A missing value is defined as a value that disables case-wise or pair-wise numerical computations and/or text analysis. However, missing do not disable data graphing, in fact missing values can be the targeted information to be graphed.
Missing values can result from a number of reasons, e.g. human recording error, computer processing of incorrectly sequenced characters, illegible responses, destroyed records, non-identification, nonsense values, refusal to answer a question, undefined calculations, and more.
Missing at random
By choosing to proceed with analysis and ignore missing values, you are implicitly assuming that these values are missing at random. This assumption may or may not be true.
In surveys the source of missing is rarely due to random variation. Surveys are expensive to administer and missing values can be very costly both in terms of money and opportunity cost. In surveys, missing values may arise from a multitude of reasons:
- Unspecified refusal to answer
- Specified refusal to answer (e.g. stating religion-sensitivity)
- Inapplicable question (e.g. asking a male if he is pregnant)
- Incomplete answer
- Transcription error by interviewer
- Illegible response
- Multiple responses (e.g. ticked both yes and no)
For instance, a specified refusal to answer is never missing at random. It contains information precisely because it is missing. If fact, surveys can be even designed so that they collect information from missing values.
Consider the following fictional (but plausible) scenario. A US presidential approval survey is conducted in January 2017 right after the inauguration of the 45th US president, Donald Trump, asking just two questions:
- Do you approve of the 45th US president?
Available answers: Yes/No - Are you a US citizen?
Yes/No/Prefer not to say
Given the election campaign messages of Donald Trump, then it is quite plausible that there would be less than expected answers for ‘No’ in question 2, and more than expected answers for ‘Prefer not to say’. If the survey reversed the order of the question then it would be more likely to observe more truthful responses.
Such insights can be easily drawn using data graphs. Consider the following similar scenario of a pseudo-survey of 5 questions using a Likert scale of Love/Like/Don’t Like/Hate. The survey also allows for the answer of ‘Prefer not to say’ that is recorded as ‘missing’:

A key insight from this set of results is that in Question 1 there was no responses of Don’t Like or Hate and the number of responses of `Prefer not to say’ was inflated by comparison to the other questions. This may mean that people who did not agree with subject of Question 1 chose to not disclose their dislike. They may be afraid or simply do not care in responding which could be the key data to the survey.
Visualising missing values
So, missing values may not be missing at random and may warrant special graphical analysis.
As an example, here is a powerful graph from The Independent that shows how countries voted at a UN resolution for ceasefire in the Middle East in 2006:

The left-hand side panel shows the countries that voted Yes, but the graph is so packed with data (very little white space), that makes it very hard to see how there are three flags ‘missing’. The designer very cleverly replicates the graph this time showing on the right-hand side panel the countries that voted No (i.e. the missing values from the panel of voting Yes). The vast white empty space is very powerful not only helps decode the data with great accuracy but also leaves a lasting impression.
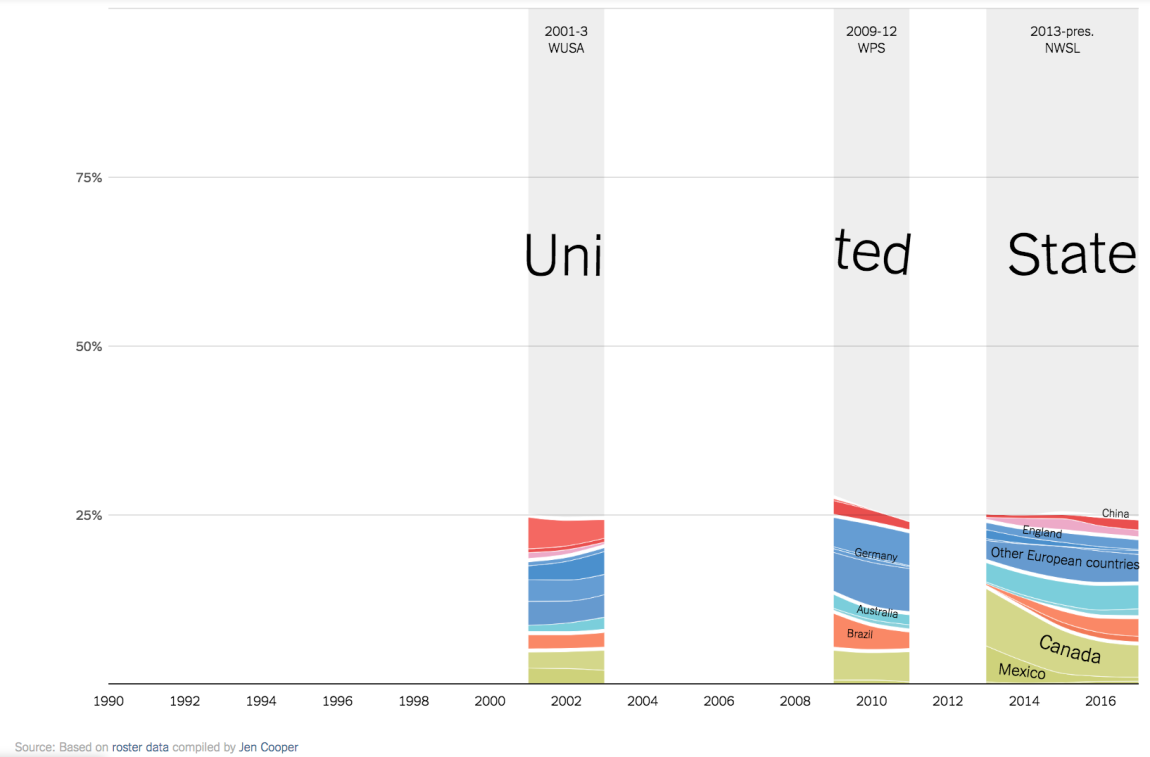
As another example of excellent visualisation of missing values consider this graph from New York times:

The stacked-flow graph shows the composition of the professional women’s soccer league in terms of players’ country of origin. The most important piece of information in the graph are the ‘missing’ years that show the years that the professional league did not exist. The missing years showcase the lack of investment in women’s professional soccer league despite the fact that the women’s US team have won four times the World Cup (1991, 1999, 2015, 2019).
Back to Data validation ⟵ ⟶ Continue to Recasting scales