Visual implantations need retinal variables to be encoded, and retinal variables take visual parameters. For example, a point visual implantation can be encoded using the shape of a hollow circle and the colour blue. A line can be encoded using a solid pattern of thick size and green color. An area can be encoded using a 20% transparent red colour and thin line borders.
Bertin (1967) describes visual implantations as dimensionless elements with underlying coordinates that necessitate the encoding of retinal variables in order to become visually informative. He identifies six fundamental retinal variables:
- Colour hue (e.g. blue, green, magenta).
- Colour value (lightness vs. darkness).
- Size (e.g. large, small, thick, thin).
- Shape (e.g. circle, rectangle, diamond).
- Orientation (e.g. angle, degrees).
- Texture (e.g. dashed lines, polka dots).
The eye is independently sensitive to these retinal variables, which means that more than one retinal variables can be deployed at the same time in order to encode different variation in the data.
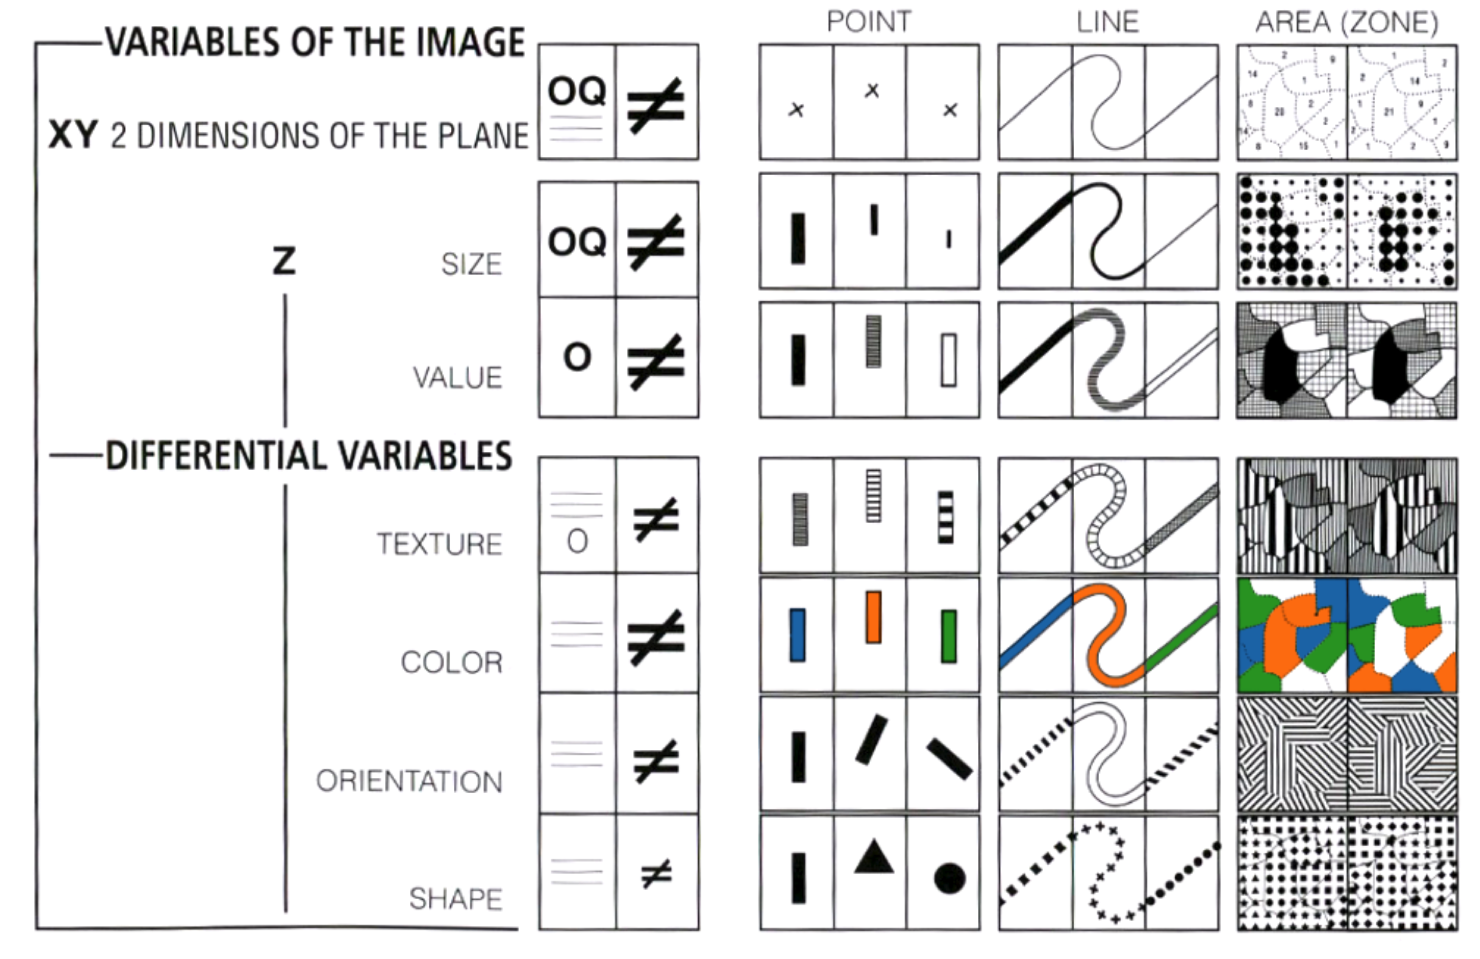
The following is a figure from Bertin (1967) describing the implementation of retinal variables in conjunction with visual implantations:

Retinal variables encode visual implantations (points, lines, areas) and can be used to represent differences (≠), similarities (≡), a quantified order (Q), or a qualitative order (O). For example, representing differences between the categories of Yes and No when responding to a survey is best done with the retinal variables of color, orientation and then shape (notice the varying size of the unequal symbol ≠ indicating difference in perceptual understanding). Representing differences between Yes and No using the retinal variable of size would be wrong, e.g. large circles for Yes and small circles for No, because then our perceptual system would be led to believe that Yes is more important than No.
There is a seventh retinal variable, not listed by Jacques Bertin (1967), which is:
7. Motion (animation)
We can detect motion and perceive differences in speed as an independent piece of information by comparison to the other six retinal variables listed above.
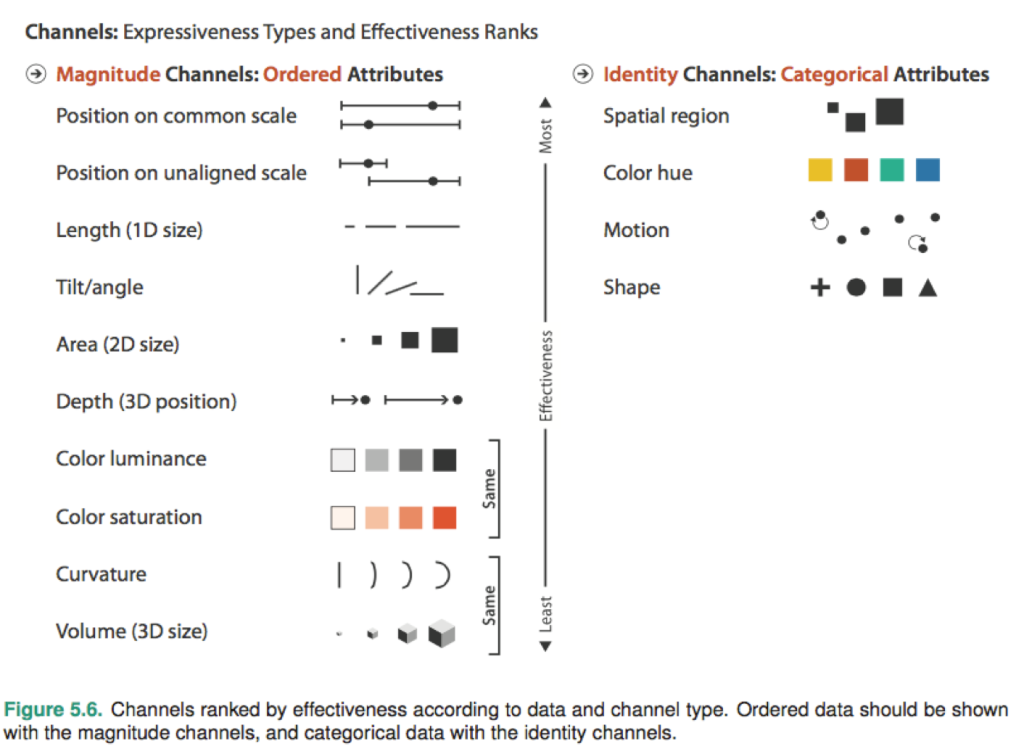
This set of seven retinal variables are today referred to as ‘visual channels’, and the visual implantations are referred to as ‘marks’. For example, below I provide Figure 5.6 from Tamara Munzner’s (2014) excellent Visualization Analysis and Design:

Since the Graph Workflow has been inspired directly from the work of Jacques Bertin, I prefer to use his original terminology and classification, as translated by Howard Wainer.
Case study continued
Recall the incomplete case study that is considered in the discussion of visual implantations. Here is again that incomplete graph:

This case study demonstrates how to move from the point, to the line and finally to the area implantation each time encoding an additional piece of information. But using points, lines and areas can only get as this far: three pieces of information.
To encode additional information we need to consider encoding variations in points, lines and areas and this is where retinal variables come into play. We are unable to distinguish between prices falling or rising within a day because the all points, both line and both areas are encoded with identical retinal variables.
Specifically, the left-hand side graph above uses point implantations to encode the position of each price, but is very much uninformative because it does not distinguish between close, open, high and low prices. The retinal variable of shape can help distinguish between these categories, e.g. by showing the open price as an open circle, the close price as a filled circle, the low price as an open square and the high price as a filled square. This solution is shown in the left hand-side graph below. It is an improvement but still lacks considerable decoding efficiency because of the excessive mental effort required to comprehend and remember the role of every symbol.
The middle graph above uses the point implantation as well as the line implantation to encode the connection between open-close and low-high, but is also uninformative because the direction of the two lines is the same and it is impossible to distinguish the length of each line. The retinal variable of size could help by placing a larger weight (width) in one of the lines, so that it appears thicker than the other. The point implantations now become redundant as the thicker lines can also help decode position. This solution is shown in the middle graph below.
The right-hand side graph above uses the area implantation to encode the range of open-close prices which is an important piece of information in this context, as the difference between the closing price and opening price gives the return earned (if positive) or suffered (if negative). In fact, the thicker line solution in the middle graph already resembles to a rectangle area. So, we could make this design step more explicit and replace the thicker line that encodes the connection between open-close with a more obvious rectangle area. This shift to area gives the opportunity to employ the colour retinal variable to condition areas that indicate increase in navy colour, and areas that indicate decrease in red colour.

Indeed, the right hand-side graph is a well-known solution in financial technical analysis, and is used by high frequency traders and robotic algorithms to make quick decisions about selling or buying securities. This is known as the candlestick chart.
The point of this case study is to demonstrate how one can develop any data graph by starting by encoding the point visual implantation on a coordinate system, then move to lines and areas, and then condition the visual implantations using retinal variables in order to encode additional information.
To learn more how to implement the retinal variable, follow the links for colour hue, colour value, size, shape, orientation, texture, and motion.
Back to Volumes ⟵ ⟶ Continue to Colour hue