Fonts are probably the most under-looked and underestimated design feature.
Graph identification must be legible both in terms of font type and font size. The font color should always be a neutral black or dark gray. We never use font colours to decorate as it violates the quality of consistency. Also, we never use italicised, underlined or boldface font types unless it is for encoding specific type of variation.
There are two broad classes of font types.
Sans serif fonts
Sans serif fonts are designed to be clearly legible from distance in large size, and for small amount of text as in posters and headlines.
In data graphs, we use sans serif fonts in grant titles, axes titles and legends. Two very popular options are the following:
This is the font type Helvetica. It is the hero of fonts and used for legible signing across the world, also in many company logos.
This is the font type Avenir. It is designed specifically for the computer screen. It is clear, legible and composed. It does not shout out for attention.
Serif fonts
These fonts are designed to be legible in large amounts of text especially in small sizes. We use them in lengthy notes and captions. Here are two popular choices:
This is the font type Garamond. It is used for packed bodies of text and very small fonts, like in books. Probably not necessary for graphs.
This is the font type Palatino. It is most appropriate for annotating captions and notes.
You can think about combining one Sans Serif font and one Serif font in every graph. I often like to apply the combinations of Avenir and Palatino.
This website has been build using Muli font for the very large titles, and Palatino font for all main text. WordPress requires upgrading to an expensive Business plan in order to access more fonts including Avenir.
Silly fonts
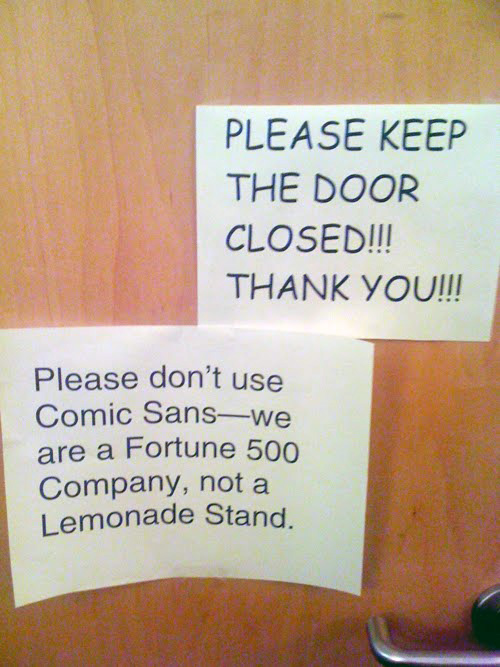
Do not try to be cute with the choice of fonts because it will backfire. Font should not steal the spotlight. Remember that the data is the only hero. The most ridiculous font is probably Comic Sans. Here is a warning:
Back to Direct identification ⟵ ⟶ Continue to Graph enhancement
