Visual implantations is a term introduced by Jacques Bertin in Semiology of Graphics (1967), as translated in English by Howard Wainer in the 1983 edition, to separate the notion of factual data from its encoding in a graphical manner. Indeed, the data is the single truth that is absent of any error, assuming quality Data Management, but the manner in which it is encoded may introduce estimation error in decoding.
Given the two fundamental principles of the Graph Workflow (stochasticity and encoding data on a coordinate plane), the embryonic step of every data graph is the point visual implantation that encodes coordinates on a plane.
Coordinate systems
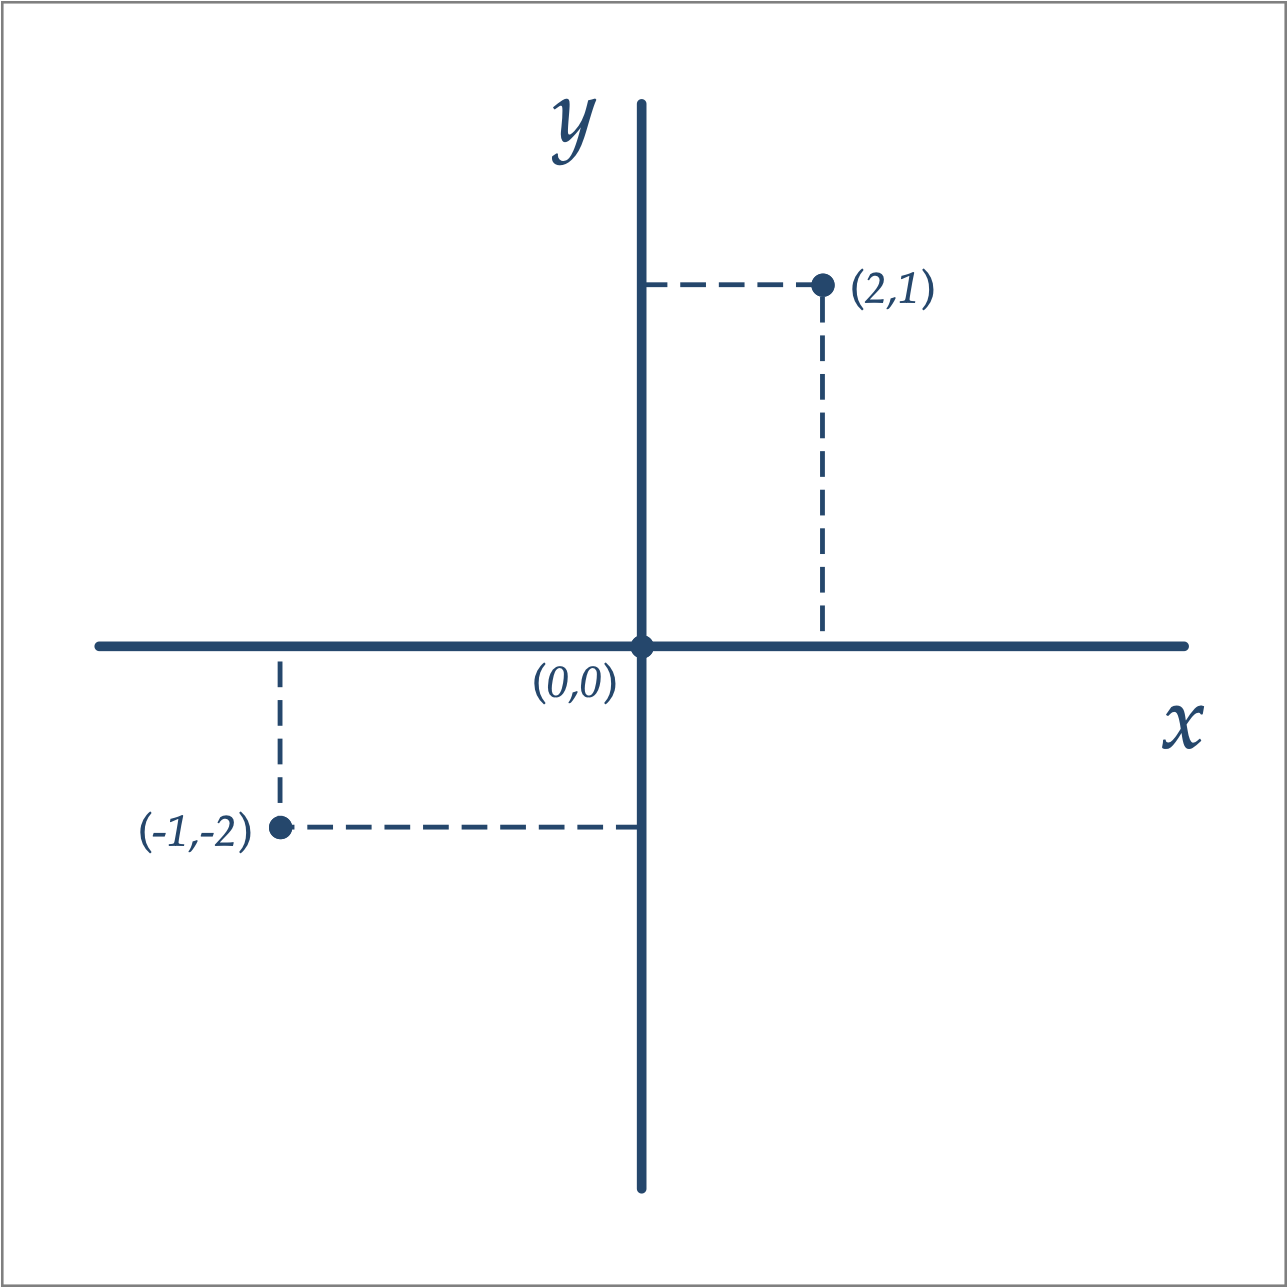
The encoding of data can be done in any coordinate system. The most well known coordinate system is the Cartesian form, which this is the default of Stata and other software:
However, there are many coordinate systems that could be used:
- Cartesian coordinate system: presents the scale of two variables perpendicular to each other, as per above.
- Geographical coordinate system: a special class of Cartesian form that presents geographical positions relative to the Equator (the 0° parallel of latitude) and the Prime Meridian (the 0° of longitude).
- Parallel coordinates system: presents the scale of several variables parallel to each other.
- Polar coordinate system: presents the scale of several variables in an angle from a reference point.
- Diametrically opposed coordinate system: presents the scale of two variables diametrically opposed to each other.
- Ternary (or simplex) coordinate system: presents the scale of three proportions that add to a constant as barycentric positions in an equilateral triangle.
- Network coordinate system: a special class of coordinates that is determined on the basis of density in network nodes.
There are others. The encoding of visual implantations begins by an investigation of which coordinate system would be the most appropriate for analysing the graph objective.
Implantations
Following the choice of coordinate system, the first step is to encode points as coordinates.
Point visual implantations (i.e. encoding just a dot in a coordinate plane) encode a position but are without direction. A scatter graph is therefore the most fundamental form of data graph as its purpose is to encode the point visual implantations. In data graphs, points may reflect the position of data, or could be artificially inputted by the user for tagging elements in a graph.
Line visual implantations connect two data points through space and therefore encode direction and length. Lines can be of rectilinear form or curvilinear form. Segmented straight lines may also be connected to give the impression of a curvilinear relationship as in the local polynomial estimator.
Area visual implantations connect lines to give rise to two-dimensional enclosures. So, while points have the dimension of position and lines have the additional dimension of length, areas now have the added dimension of width. Areas can be of rectilinear form (e.g. polygonal) or curvilinear form (e.g. elliptical). Areas have boundaries (the lines) and the enclosed surface can serve as an additional layer of encoded information.
Continue to learn about how to move from points to lines and areas. See also the case study for implantations, and a warning against using volumes.
Back to Extreme values ⟵ ⟶ Continue to Points to lines to areas
