Variables taking values within the range of [0,1] typically describe portions, such as proportional rates and prevalence rates. The ladder of power transformations or the Box-Cox type of transformations cannot be applied with variables that have bounded support within [0,1].
Most [0,1] variables can be modelled using the Beta distribution, but not everyone knows what is a Beta, and certainly this would be hard to explain in business context. Instead, I would like to discuss a practical and quite popular type of transformation that can turn a [0,1] variable into near normality.
Logit transformation
The most widely accepted solution for transforming [0,1] variables into symmetry is the logit function:

where p is the [0,1] variable. The logit transformation is often described as the ‘log of the odds ratio’, that is to say it is the log ratio of the odds of p to the odds of 1−p. The logit transformation transforms the [0,1] variable into [–∞,+∞], by stretching out the tails to infinity and shifting the middle in about a symmetric manner.
The logit function is one of the most important and widely used types of transformations. They apply anywhere an S-shaped relation is to be modelled. They are excellent descriptors of growth functions where some measure grows slowly at the beginning, the accelerates and then slows down again. For example, in the diffusion of knowledge, such an S-shaped relation can describe the slow dissemination of knowledge at first, then the accelerated spread of an idea and finally fading away as other ideas take hold.
Motivating application
Consider the example of video game sales of different platforms (e.g. PSP, Wii) during 2004-2016, by region: North America, Europe, and Other geographical regions. The dataset is sourced from Kaggle. The question of interest is to examine the market share of different game platforms, and the sensitivity of global sales to the market share.
I measure market share as the portion of sales per year of each platform in each region. There are three variables: the portion of sales in North America, the portion of sales in Europe, and the portion of sales on Other geographical regions, and they look like this:
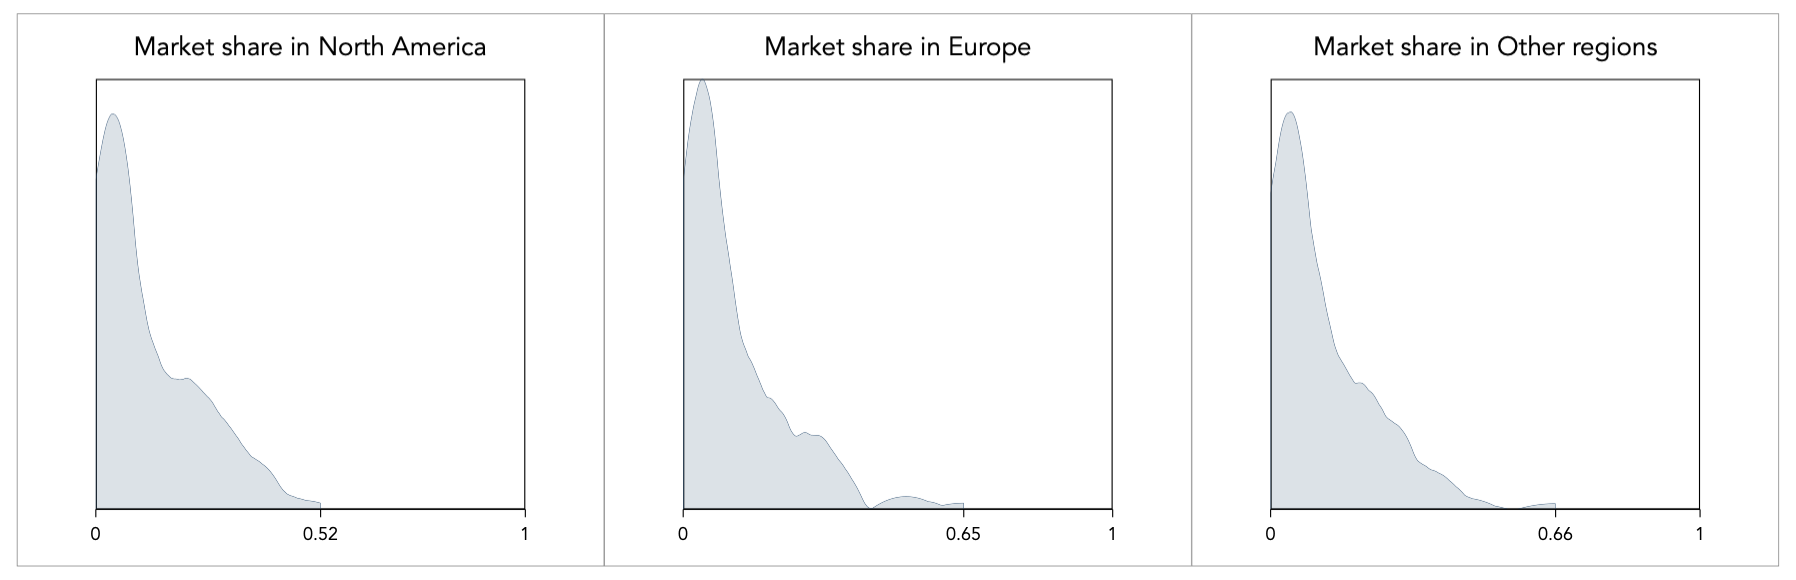
The platform market share per year goes from 0 to maximum 0.66 in Other regions. The market share does not reach the value of 1, but there are some instances of 0 market share, specifically 3 observations in the North America market share, 3 observations in Europe, and 2 in the Other regions. This creates a problem for the logit transformation because the function is undefined for the values of p=0 and p=1 (see above formula).
Instead of losing these observations as missing, the standard approach is to add a constant k for the observations that are equal to 0 and subtract k for the observations that are equal to 1. A general rule general of thumb is to define k=0.025, but this relies on the assumption that 1/40 and 39/40 are exceptionally unlikely probabilities, which may or may not be true. Alternatively, we may determine k using a data-driven approach, e.g. equal to the minimum half-distance between 0 and the lowest proportion or between 1 and the highest proportion. For this data, I find that k=0.000108, so the rule of thumb of 0.025 would surely be inappropriate.
I take the logit transformation for each one of these variables, and I superimpose the theoretical normal, shown here in orange colour:

The transformation effect is quite effective. Apart from the slightly inflated probability at the far left due to the addition of k, the rest of the density appears to be behave very nicely. Given the
Global sales is a [0,+∞) variable that is lognormally distributed, thus taking the log turns it into Normal. I can then run a regression of log-global sales on the logit-transformed market shares in North America (NA), Europe (EU) and Other regions (OT). The resulting estimates are:

The adjusted R-squared is 0.8876, and although there is some multicollineary it is does not seem to be worrying and we can still talk about the relative magnitude of the estimates (the largest variance inflation factor is 8.58). We can now say that a unit increase in the log of odds ratio of the European market share will bring a far greater increase in global sales by comparison to North America or Other regions.
Back to (–∞,+∞) variables ⟵ ⟶ Continue to Reference List
