Direct identification directly identifies marker-specific descriptions about important values in order to help resolve uncertainty and providing useful context.
An American Statistical Association standard for Graphical Presentation, also advises that when the data is not voluminous then it pays off to encode the data values as part of the graph:
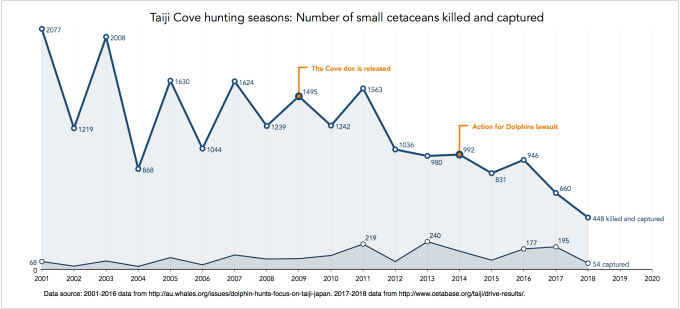
ASA standard: Where possible, encode numerical ordinates using marker labels to indicate underlying characteristics.
The analysis on Taiji Cove Drive Hunt provides such an example, whereby all data values are directly identified as part of the plot:
Functional forms
Often, we need to encode functional forms to show how the data supports our theory and the accuracy of our predictions using a model. When we do so, then there is another ASA standard that asks that we directly identify this functional form:
ASA standard: When graphing functional forms then display the formula as part of the graph.
Here is an example of how this could look like, here fitting a linear regression function on the relation between travel time and the generalised cost of travel for using planes to commute from Melbourne to Sydney:

Notice how I also apply the orientation retinal variable to rotate the angle of the plane markers so that they appear to be flying parallel to the fitted regression line.
Back to Internal identification ⟵ ⟶ Continue to Fonts
