Visual illusions are an acute reminder of our visual system limitations. Even when we know that we are looking at at illusion we seem unable to learn or update our understanding. As explained in the discussion on visual perception, we do not see with our eyes – we perceive, hypothesise and interpret with our brain.
Richard Gregory describes visual perception under a hypothetico-deductive model whereby memory and context association sets a prior belief that visual stimuli update towards a new understanding (Gregory 1966, 1970). He identifies four cognitive-type of illusions, which are directly relevant to designing effective data graphs.
Ambiguous illusions
Ambiguous illusions are visual objects that have more than interpretation. For these objects, we seem unable to focus our attention to just one of these interpretations and we alternate between the equally-likely interpretations.
A good example is the impossible stacked cubes illusion. One of the cubes appears to be protruding outwards and the other inwards, and the cubes appear to alternate. Another classic the cube-in-a-cube illusion, where we perceive the smaller cube to alternate from being a cut-off segment from the bigger cube or protruding outwards. Regardless of how long we stare on this shape we cannot make up our ming which is which because both hypotheses appear equally likely:


The constant switch to the equally-likely alternate states in ambiguous visual objects is known as perceptual multistability. For other examples, see the Necker’s cube illusion and Rubin’s vase that is also discussed in the analysis on Gestalt principles of perceptual organisation.
The problems associated with decoding information subject to ambiguous illusions is also the key reason for abandoning the use of volume implantations.
Paradoxical illusions
Paradoxical illusions involve objects that violate our understanding of the three dimensional world as we find it impossible to process the object in 2D. The most celebrate work of Maurits Cornelis Escher is a celebration of paradoxical illusions; see as the Relativity and the Waterfall lithographs.
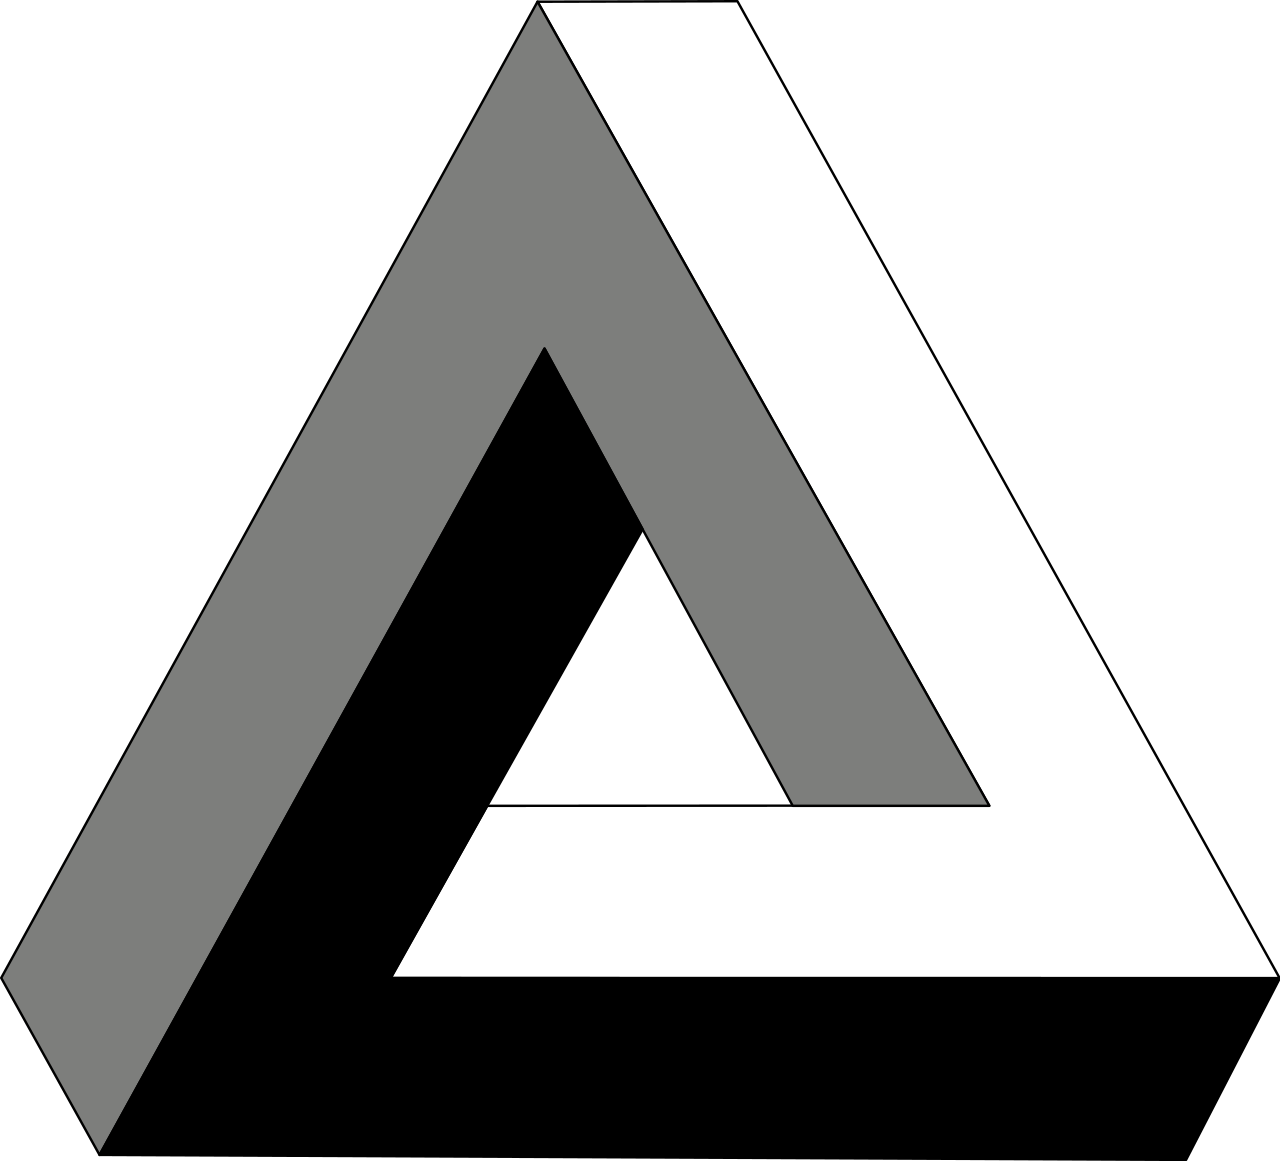
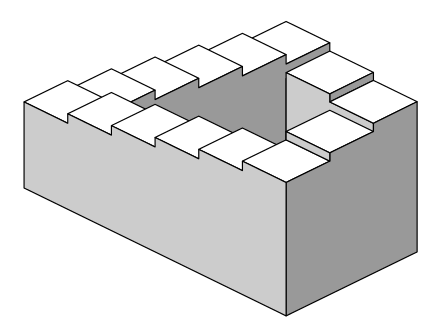
The celebrated mathematician and physicist Roger Penrose was also fascinated by such seemingly impossible objects, the most well-known being the Penrose triangle and the Penrose impossible stairs:
Fictional illusions
Fictional illusions describe our tendency to organise visual perception by creating objects that are not there, in accord to our prior experience (as in Bayesian update). For example, in the objects below, the so-called Kanizsa triangle and the Hidden Necker’s cube, we perceive the existence of triangle and cube although there are none. There are other objects whose contours imply the outline of another non-existent object:
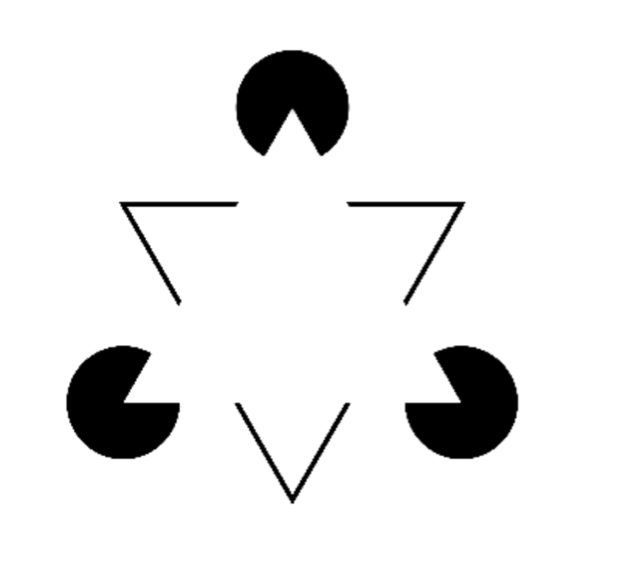
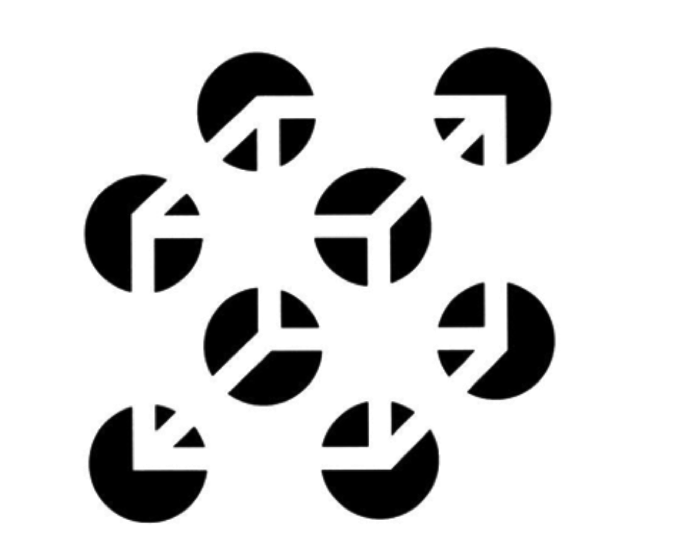
Fictional illusions or Illusory contours suggest an important lesson data graphing: never discontinue an object because then the viewer will perceive discontinuity according to prior expectations as defined by the surrounding information that is visible.
I explain further this lesson with an example in the analysis of the Gestalt principle of Closure.
Distortion illusions
Distortion illusions, also known as Geometrical-optical illusions, are objects whose properties are interpreted by comparison to the properties of the surrounding objects, and therefore lead to erroneous conclusions.
This type of illusion can cause the most damage in visual decoding, and must be well-studied by all interested in data graphing. For example, consider the Müller-Lyer Illusion – can you say which of the two lines is the longest?

Both lines are of equal length, but we perceive the line on the left to be of greater length. This because our visual system has learned to judge depth and distance by hypothesizing that when angles point inwards describe objects that are closer, and when angles point outwards describe objects that are further away so that those lines should ‘logically’ be longer.
According to Keith (2012) this visual illusion emanates from the fact that most modern humans grow up indoors and develop a perception of perspective in environments surrounded by corners. Thus, angles of objects further away would point outwards and angles of objects closer to us point inwards. This hypothesis is based on the early observation by Rivers (1905) that indigenous tribal peoples who do not not live in environments defined by corners do not see to be fooled by such visual illusions.
The Müller-Lyer Illusion of course has important implications in data graphing. It would be a mistake to compare length of arrows with obtuse and acute angled barbs in the same graph.
Another important distortion illusion for data graphing is the Ebbinghaus/Titchener illusion, where the perceived size of a circle is distorted according to the size of the surrounding circles, as for example:
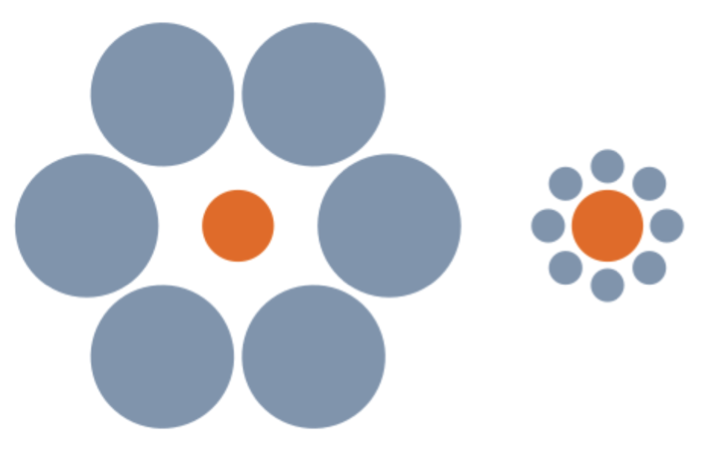
Both orange coloured circles are the same size, yet we perceive the one of the right to be much larger. The closer are the surrounding circles to the inner circle the stronger is the distortion. This illusion suggests that using the so-called circle packing for drawing any form of comparisons is doomed to fail.
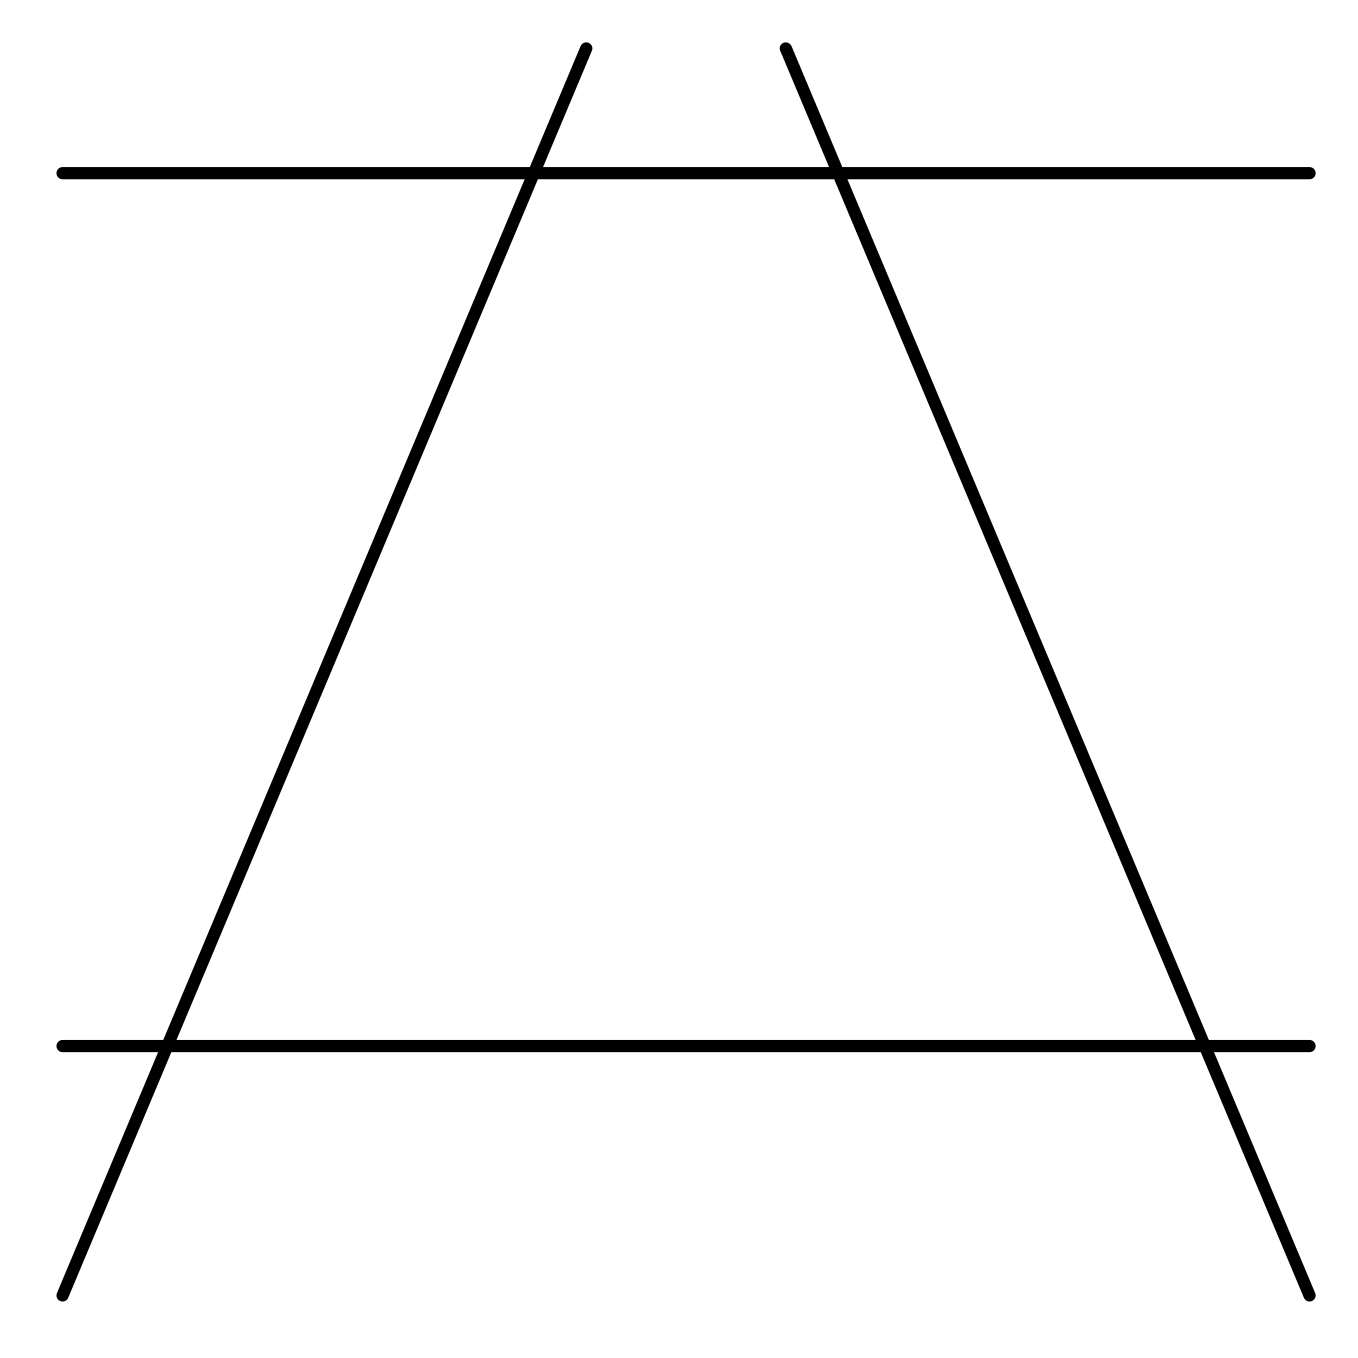
Two other prominent examples of distortion illusions are the vertical–horizontal illusion (on the left) and the Ponzo illusion (on the right):
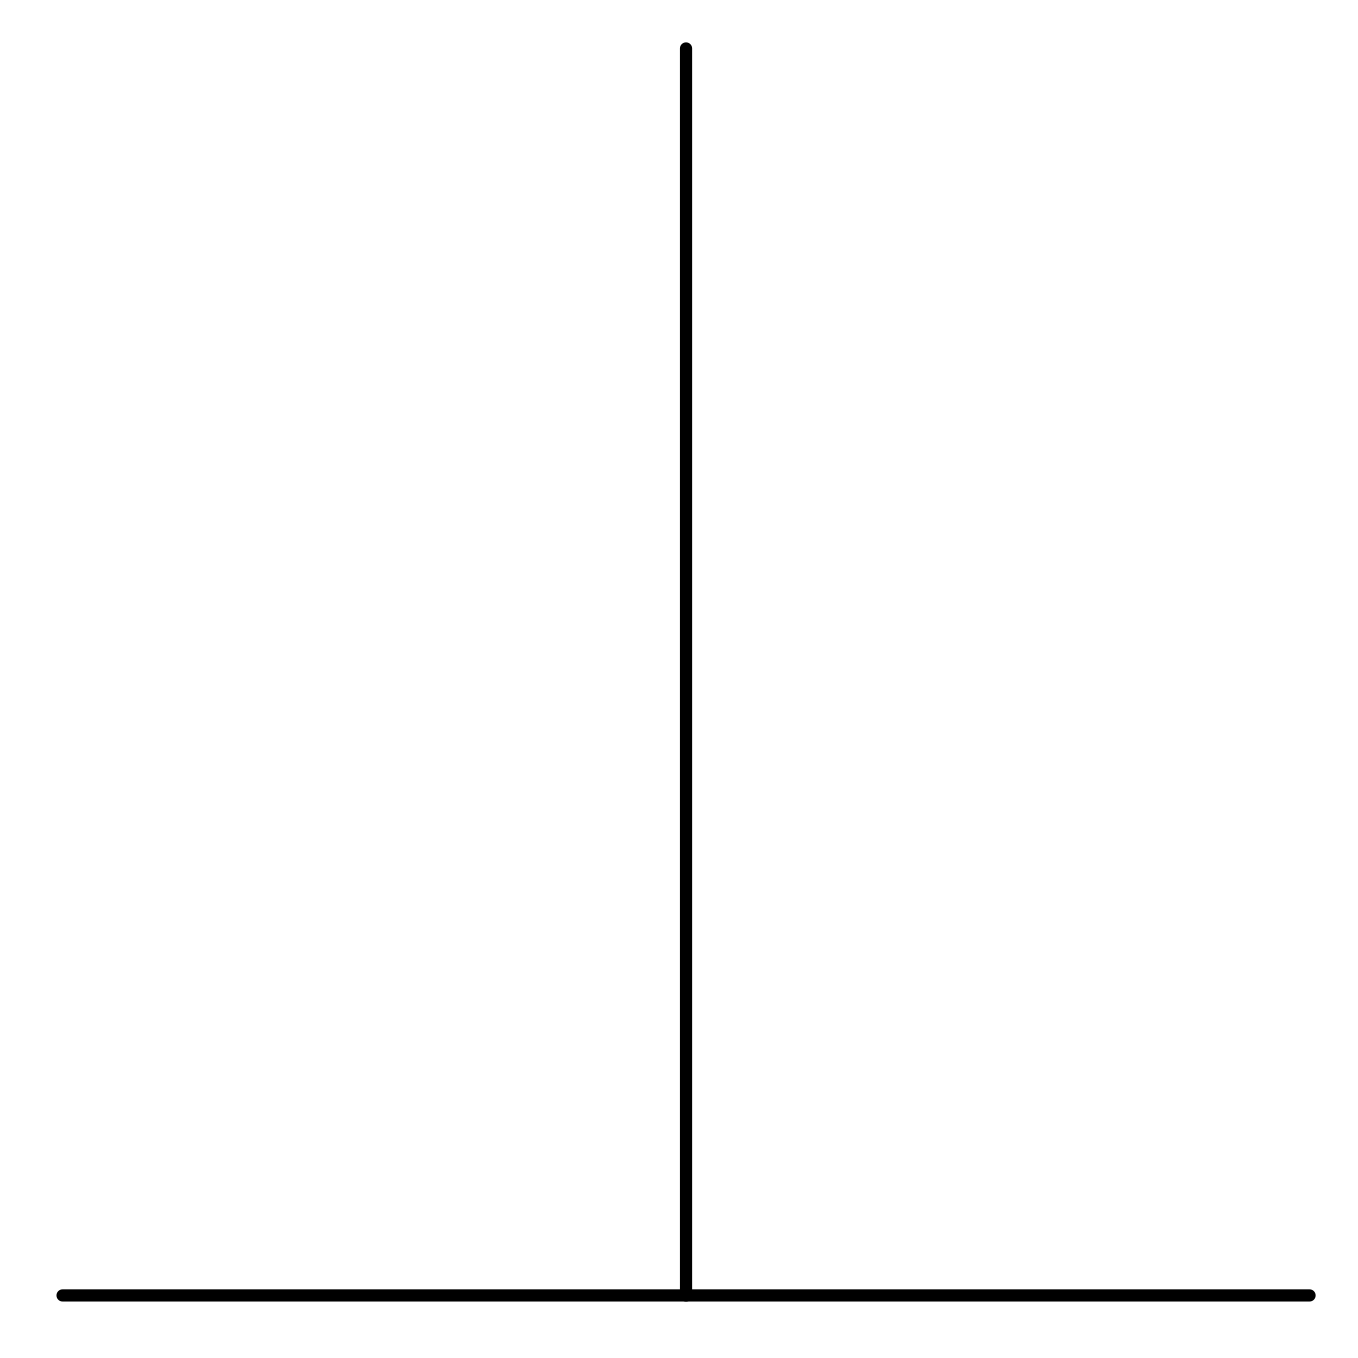
In the vertical-horizontal illusion we perceive the vertical line to be longer than the horizontal line. This is the same effect as us perceiving a building to be taller and a road shorter than they actually are.
In the Ponzo illusion, we perceive the top line to be longer than the bottom line because we perceive the vertical angled lines as parallel that converge into a vanishing point. So, we think that the top line is further away and therefore it must be logically longer.
Given the regular use to line implantations in constructing data graphs both of these illusions have important design lessons.
Back to Visual decoding ⟵ ⟶ Continue to Gestalt theory
