External identification requires the following information:
- Grant title describing the graph objective, and optionally an additional subtitle for describing the data context.
- Caption acknowledging the data source, any data exclusions, and how to decode unfamiliar aspects of the graph.
- Axes titles describing the variable and its unit of measurement.
- Axes labels describing the scale, the minimum and maximum, plus any threshold values and baselines
- Added text summarising key results.
In fact, graphs without external identification do not meet the American Statistical Association for Graphical Presentation.
Loaded narratives
The audience naturally seeks explanation from the graph’s supportive identification. If identification presents a ‘loaded’ narrative, using priming or framing statements, then decoding will surely be biased.
A good example of loaded narrative is the April’s fool article by Messerli (2012, New England Journal of Medicine) on how nationwide consumption of cocoa may be related to the population’s cognition. The basis of this argument was based on the idea that cocoa contains flavanols that are known to improve cognitive function. The funny part is that Messerli used Nobel laureates per capita as a proxy for the population cognition level. Again, this was meant to be a joke and was incorrectly picked up by others as a serious piece of work.
However, I think that the joke is also on Messerli because, according to Reuters Health, he said: “I could not believe my eyes… All the countries linked up neatly on a graph, with higher chocolate intake tied to more laureates“. This is the graph that Messerli reported in the published paper:
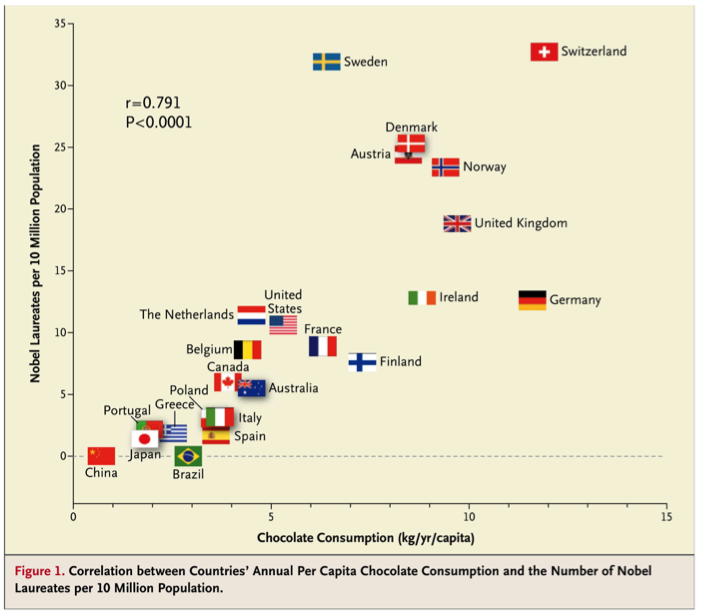
Messerli (2012) summarises his findings as follows: “There was a close, significant linear correlation (r=0.791, p<0.0001) between chocolate consumption per capita and the number of Nobel laureates per 10 million persons in a total of 23 countries (Fig. 1). When recalculated with the exclusion of Sweden, the correlation coefficient increased to 0.862.“
I find it astonishing that Messerli saw any correlation at all. He meant this article as a demonstration of the potential dangers in the fallibility of science, but the analysis is not based on any scientific approach at all.
First, the data frame is all screwed up. The graph violates the second most important quality of data graphs, that of completeness. It cherry-picks 23 countries with Nobel prizes and excludes another 78 countries with Nobel prizes. It ignores all the other countries that consume cocoa but have yet to win a Nobel prize (i.e. Nobel prizes are 0). To make matters even worse, Messerli excludes Sweden because it messes up his calculations of the product-moment correlation coefficient.
Moreover, the data covers different periods; in Messerli’s words: “Data were available from 2011 for 1 country (Switzerland), from 2010 for 15 countries, from 2004 for 5 countries, and from 2002 for 1 country (China).” Thus, the data is not very much comparable.
The graph also violates the quality of relevance – it is packed with unnecessary decoration (flags and long labels), and as a result it forces the false perception that the coordinates are closer to each other than what they really are. This gives the false impression of higher bivariate density and correlation.
Then, the graph primes the reader to look for a correlation pattern, both with loaded title to the graph and a loaded note of the graph with a statistical test. This is a form of coercion, because the reader does not realise that s/he feels compelled to look for correlation. This subtle trickery misleads by creating an illusory form of correlation (Chapman 1967). That is, the graph’s overall design and identification applies more weight to extraordinarily paired occurrences (like Switzerland) and lower perceived weights to the observations not supported by the correlation (e.g. Germany).
For what is worth, Messerli’s joke worked. A number of other people fell into the trap to write about how cocoa consumption is not really an important factor in landing more Nobel laureates (and stop a potential obesity epidemic). Linthwaite and Fuller (2012, Practical Neurology) follow up to say that cocoa is too bitter to consume on its own, thus why it is typically combined with milk. Li (2013, Practical Neurology) questions the validity of both chocolate and milk consumption in explaining Nobel prizes, and instead suggests that both are confounded by economic growth. There are others.
Back to Graph identification ⟵ ⟶ To Internal identification
