The retinal variable of value relates to the darkness and lightness of the retinal variable colour, but is perceived as an independent piece of information than hue. Bertin’s (1967) distinction between colour and value as different retinal variables follows from his assertion that colour hue carries an associative meaning of a qualitative nature, whereas value has a dissociative meaning of quantitative nature as it suggests intensity (a form of magnitude).
Thus, value is best employed to encode ordered and quantitative variation. Here are examples of value for the blue and red hues:

The more intense the hue the more perceived is the importance of that value. Although not technically correct, the grayscale can also be thought of as part of the value retinal variable, here shown against white and dark background:

HSV colour model
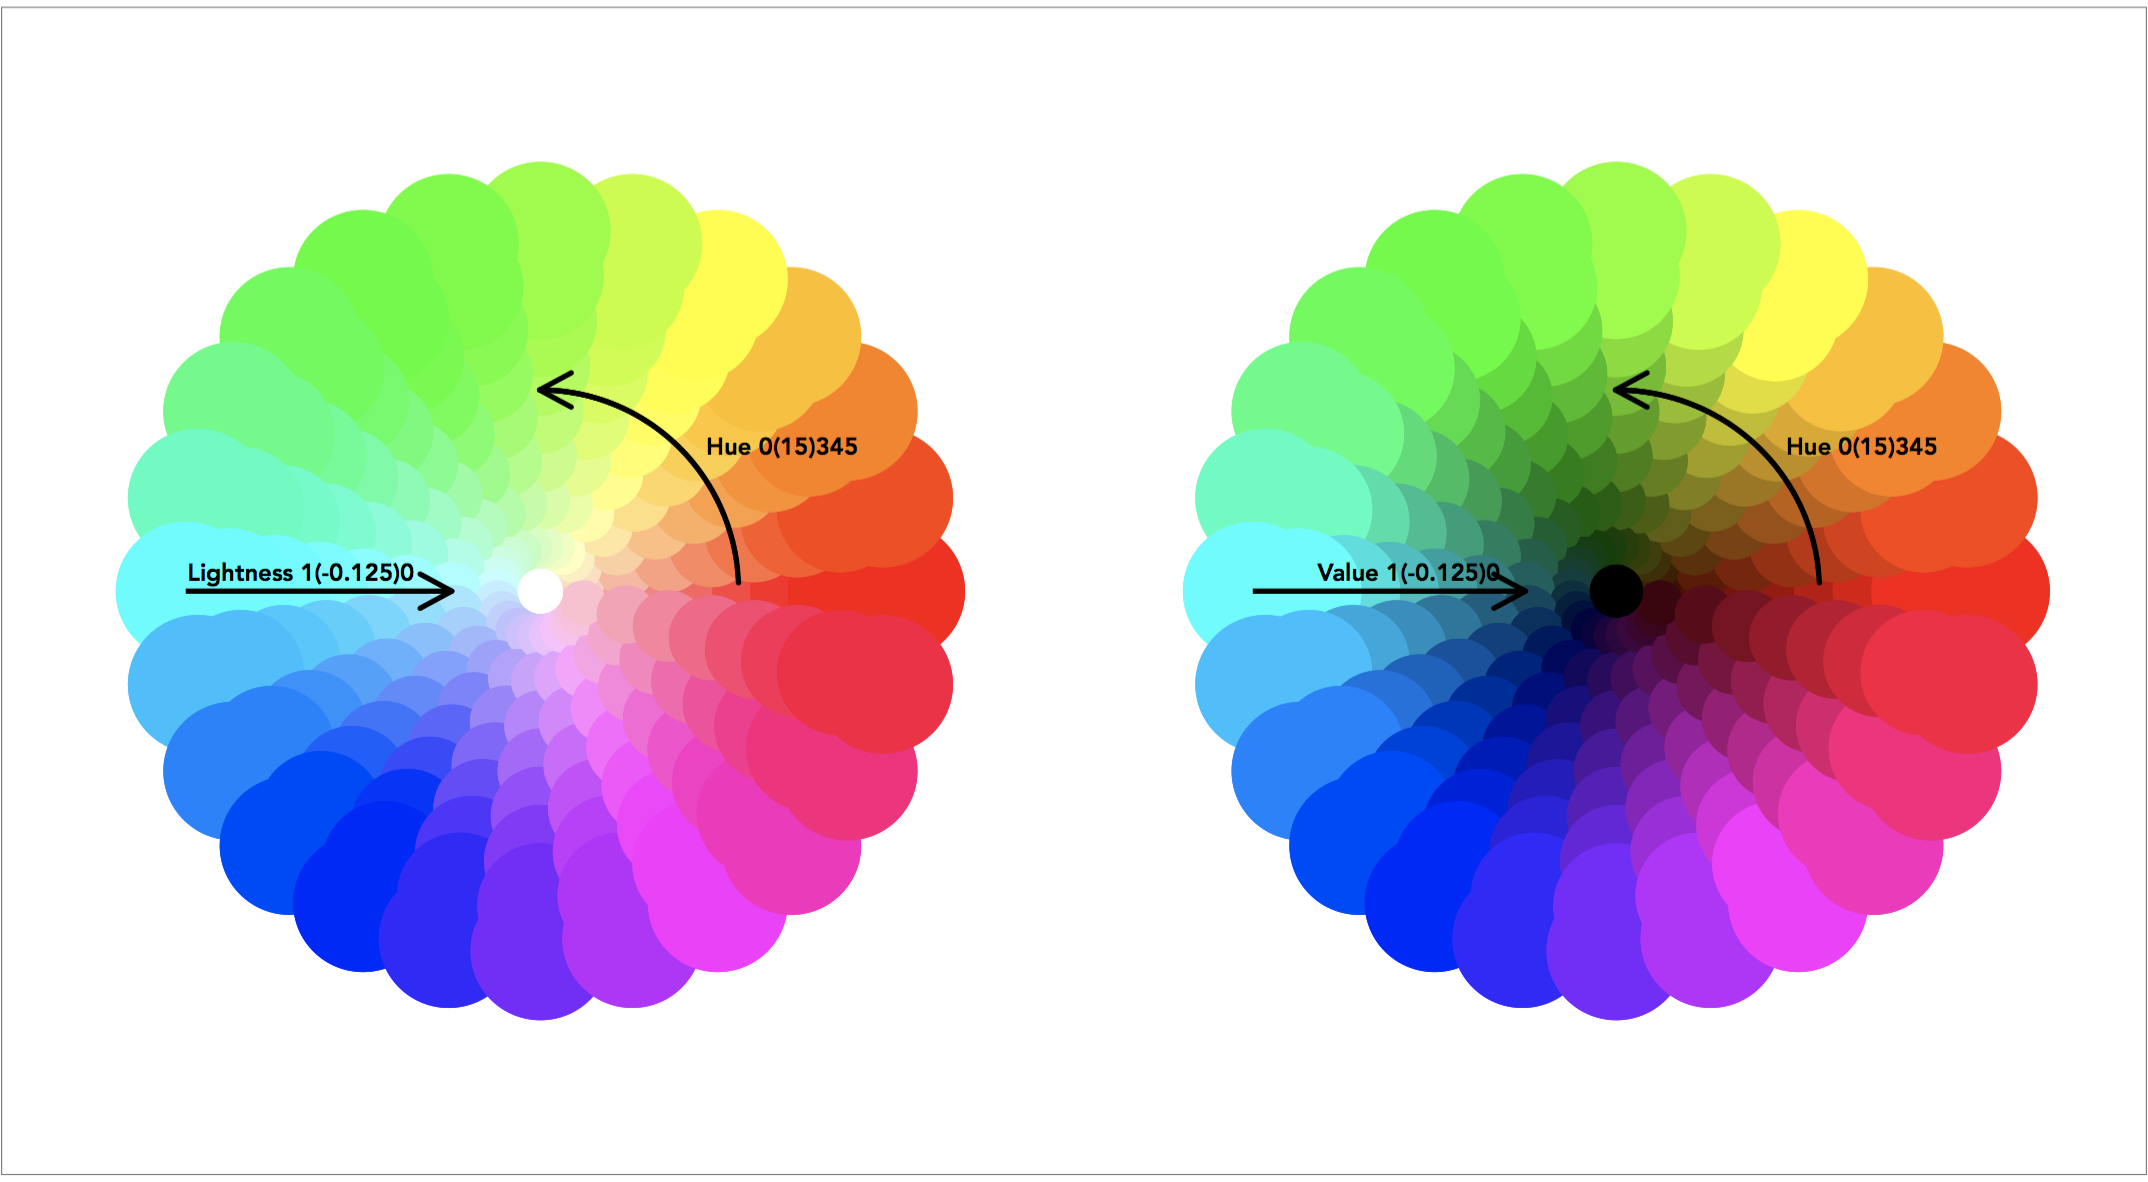
The Hue-Saturation-Value (HSV) and the Hue-Saturation-Lightness (HSL) color models assimilate the way in which humans perceive color-related attributes. Given a fully saturated hue (i.e. not accounting for the attribute of saturation), here I provide a simplified view of hue-value and hue-lightness:
In this respect, a very useful and free online tool by Laurent Jégou is the color gradients explorer that uses the HSV scale to help visualise colour values and colour saturation, between two colour hues.
Sequential and diverging color values
Value can decode evolutionary or comparative scales, e.g. evolution over time or comparison by order of magnitude. The so-called ‘heat map‘, ‘contour plots‘ and ‘choropleth map‘ rely on the concept of value retinal variable combined with one or two hues in order to decode progressive orders of magnitudes. For instructive examples of choropleth maps in sequential value scales (one hue) or diverging value scales (two hues) see the Color Brewer.
Another great online tool is http://geotests.net/couleurs/gradients_en.html that helps visualise colour values and color saturation, by contrasting two colour hues.
Overlaid translucent implantations
High density graphs may benefit from encoding implantations as translucent. Translucency then enables decoding of overlaid dense data, because the higher the density the darker the shade becomes.
This is another case of how the value retinal variable can be applied, whereby the darker the shade of colour the greater or larger the signal is perceived.
As an example, consider the following analyses: (i) on Self-disclosed height and weight where overlaid translucent point implantations reveal the cross-categories with higher density, (ii) on Greenhouse gas emissions where overlaid translucent line implantations reveal the higher density at the extremities of the bivariate relation, and (iii) on Semiconductor market share where the overlaid translucent area implantations reveal the density or concentration of market share.
Back to Colour hue ⟵ ⟶ Continue to Size
