Reference line are non-data visual elements that provide context for enhancing visual decoding.
Reference lines can take many forms:
- Axes lines (e.g. notice the specification of the x-axis line and the suppression of y-axis line in the analysis of US life expectancy of males).
- Axes grid lines (e.g. see the regular grid lines at 0.1 increments for two proportion variables in the analysis of Labour equality and human development).
- Estimated model lines (e.g. see the. model reference line in the analysis of Miles-per-gallon illusion).
- Lines indicating thresholds or policy targets (e.g. see the specification of year 2017in the analysis of Australia’s ageing population).
- Lines indicating key reference points (e.g. see the coordinate lines indicating the relative position of Australia in the analysis of OECD top marginal tax rates)
- Lines indicating key scale points, e.g. minima, maxima, zeros, averages, expectations (e.g. see the zero reference lines in the analysis of Market value function and Ratios of normals).
- Lines indicating important events describing variation in the data (e.g. see the orange reference lines drawing attention to two key events in the analysis of Taiji Cove drive hunt).
- Lines for enhancing visual perception (e.g. see the set of thick black lines separating the two sets of coloured bars in the analysis of Advisors skewing disclosures)
All in all, you can think of any line in a graph that does not directly encode data as a reference line.
Most useful enhancement tool
I classify reference lines as the most useful graph enhancement tool. I would say that I use reference lines in 95% of graphs that I create.
Remember that one of the three questions to ask when defining the graph objective, that is critical to every information system, is who is the intended audience. In other words, data graphing is a user-centred information system. This often means that showing the data alone is insufficient in helping the user decode the graph. The user often needs other supportive information to understand the context, and the easiest and most recognisable way for providing context is via reference lines.
To understand the significance of reference lines in assisting decoding, the 1914 Joint Committee on Standards for Graphic Presentation of the American Statistical Association identified 17 basic standards for drawing simple data graphs, 7 of which are directly concerned with the specification of reference lines. These standards remain in effect today.
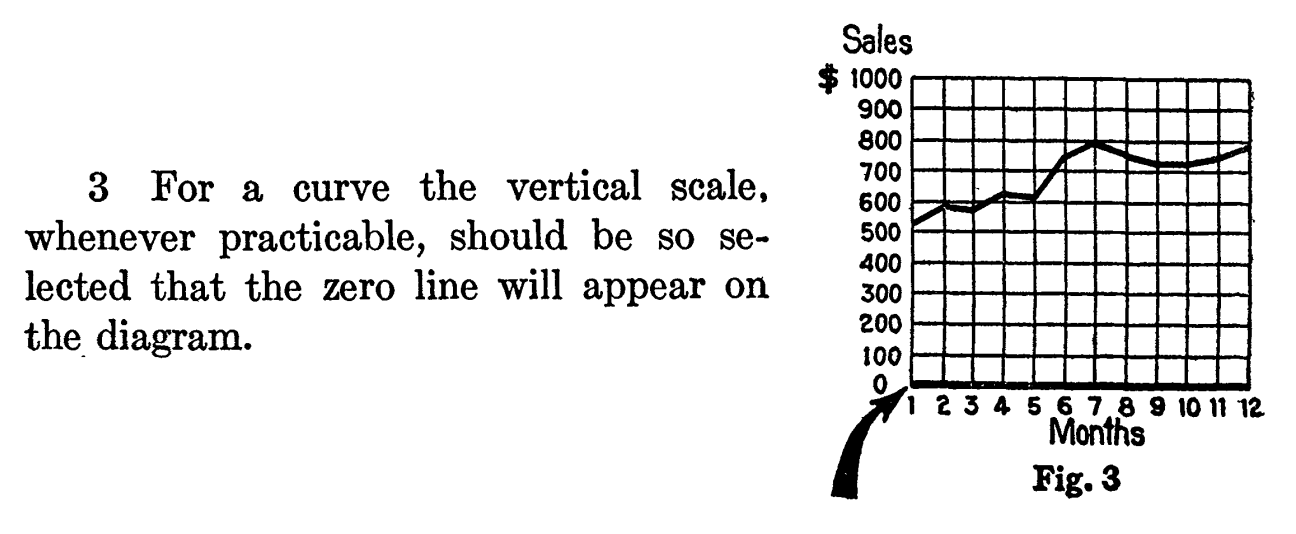
Standards no.3, no.4 and no.5 are concerned, amongst other things, with the emphasis of a reference line at zero.


Standard no.6 is concerned with the specification of reference line at 0 and 100 in percentage scales (or 0 and 1 in proportion scales).

Standard no.7 is concerned with the specification of y-axis reference lines in timeline graphs.

Standard no.9 is concerned with the specification of grid reference lines.

Standard no.10 is concerned with the specification of model reference lines.

Back to Line connection ⟵ ⟶ Continue to Reference areas
