The texture retinal variable refers to the patterned areas (e.g. polka dots, chequers) and lines (e.g. dashed, dotted).
Texture was relevant for encoding a long time ago when data graphs were limited to monochrome encoding. Remember this figure from Bertin (1967) describing the implementation of retinal variables:
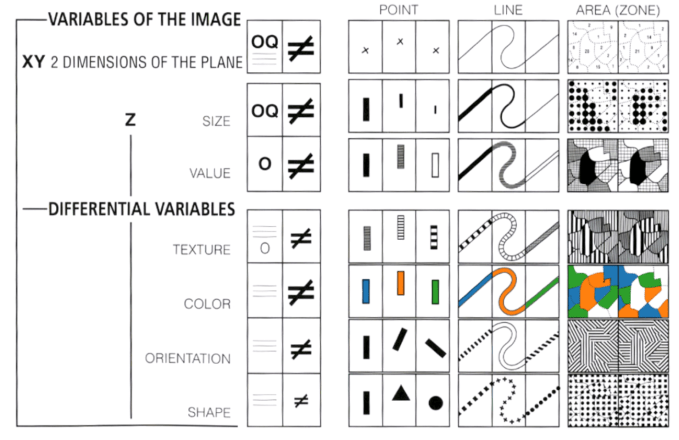
The row on Texture and its application on point, line and area visual implantations. This type of encoding method is now irrelevant, and has been superseded by the introduction of color in print and online publications. Notice how the row on Color offers a much more accurate and efficient encoding approach than texture.
Sometimes, we may need to add dashed lines as reference lines, but we never encode data using textured lines, and certainly never areas.
Moiré vibrations
Even in monochrome publications it is still recommended to stay clear from texture. Stata and other specialised visualisation software have taken the conscious decision not to support area textures such as polka dots, stripes or waves, because of harmful moiré vibration effects.
The repetitive visual patterns, as in repetitive parallel lines or waves, cause misleading visual artefacts and the impression of movement. If you staring into a textured area long enough you will get the impression that the area moves or ‘vibrates’. This effect is known as moiré vibrations.
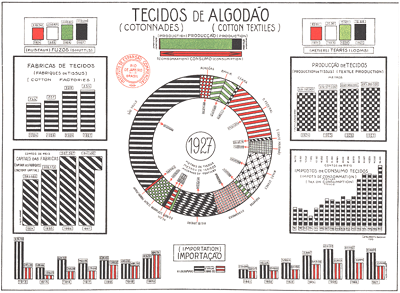
Edward Tufte (1997, p.108) desribes the moiré vibration as “probably the most common form of graphical clutter, [and] inevitably bad art and bad data graphics”, and classifies them as mere chart-junk. Here is example from his textbook:
Back to Orientation ⟵ ⟶ Continue to Motion
