Changes in physical stimuli are perceived at different intensities. This applies for any stimulus perceived by any one of our senses include visual stimuli.
Steven’s power law
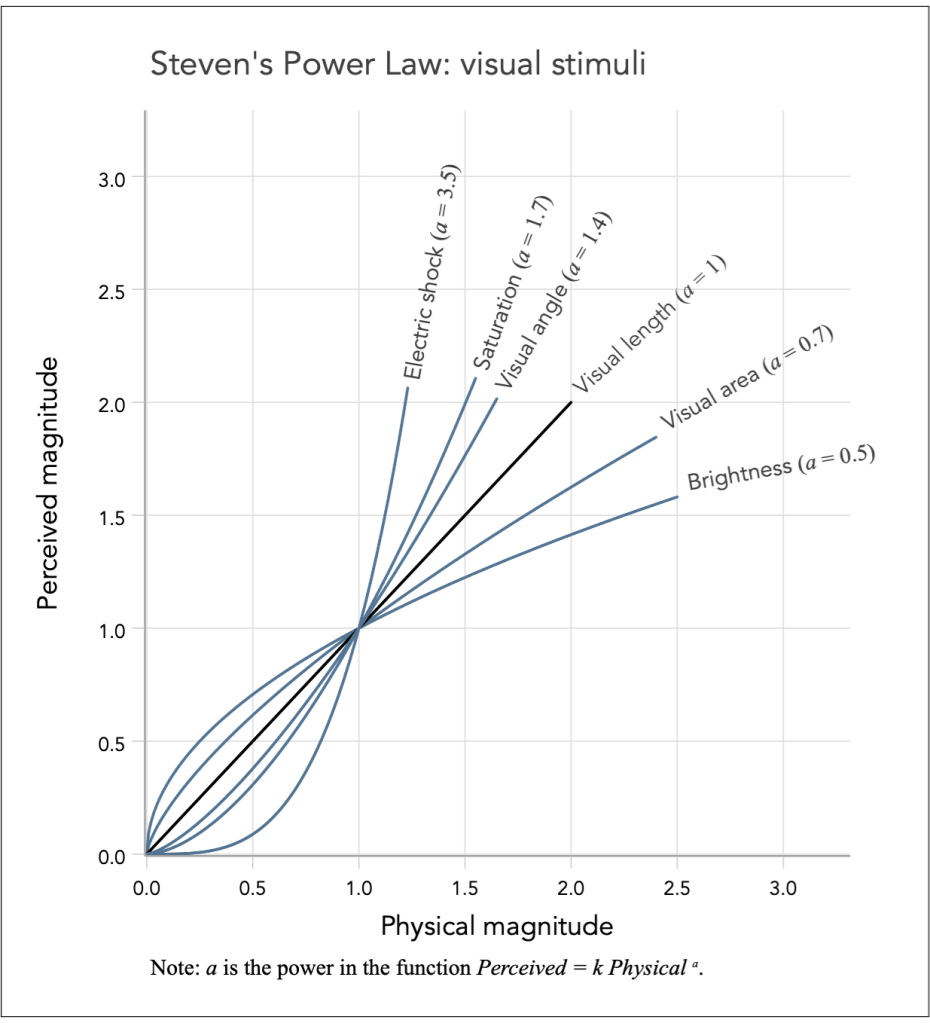
Steven’s Power Law (Stevens 1957) , in psychophysics explains the relation between the intensity in a physical stimuli and the perceived magnitude increase in the sensation created by the stimulus.
For example, the power law demonstrates that as we increase the physical intake of sucrose (common sugar) the perceived increase in sweetness sensation follows the power law of units1.3, e.g. increasing sugar intake from 1 to 2 spoons (i.e. 1 unit increase) we perceive an increase in sweetness by 21.3-11.3=1.46$ spoons. However, the perception for additional units of saccharin (artificial sugar) follows the power law units0.8, e.g. increasing saccharin from 1 to 2 spoons we perceive an increase in sweetness by $20.8-10.8=0.74 spoons.
Steven’s performed a number of experiments using visual stimuli.
Weber-Fechner law
The Stevens (1961) power law superseded the Weber-Fechner law that states that perception in human stimuli is proportional to the logarithm of the stimulus intensity, thus the perceived difference diminishes as the actual intensity increases.
For example, Josef Albers in his 1963 masterpiece Interaction of Color applies the Weber-Fechner Law in colouring theory to explain how the visual perception of an arithmetical progression in the intensity of colour, in terms of brightness/darkness, depends upon a physical geometric progression. To demonstrate this point consider the RGB scales (224 224 224) and (0 255 255); to learn about RGB scales see my discussion on the color hue retinal variable:
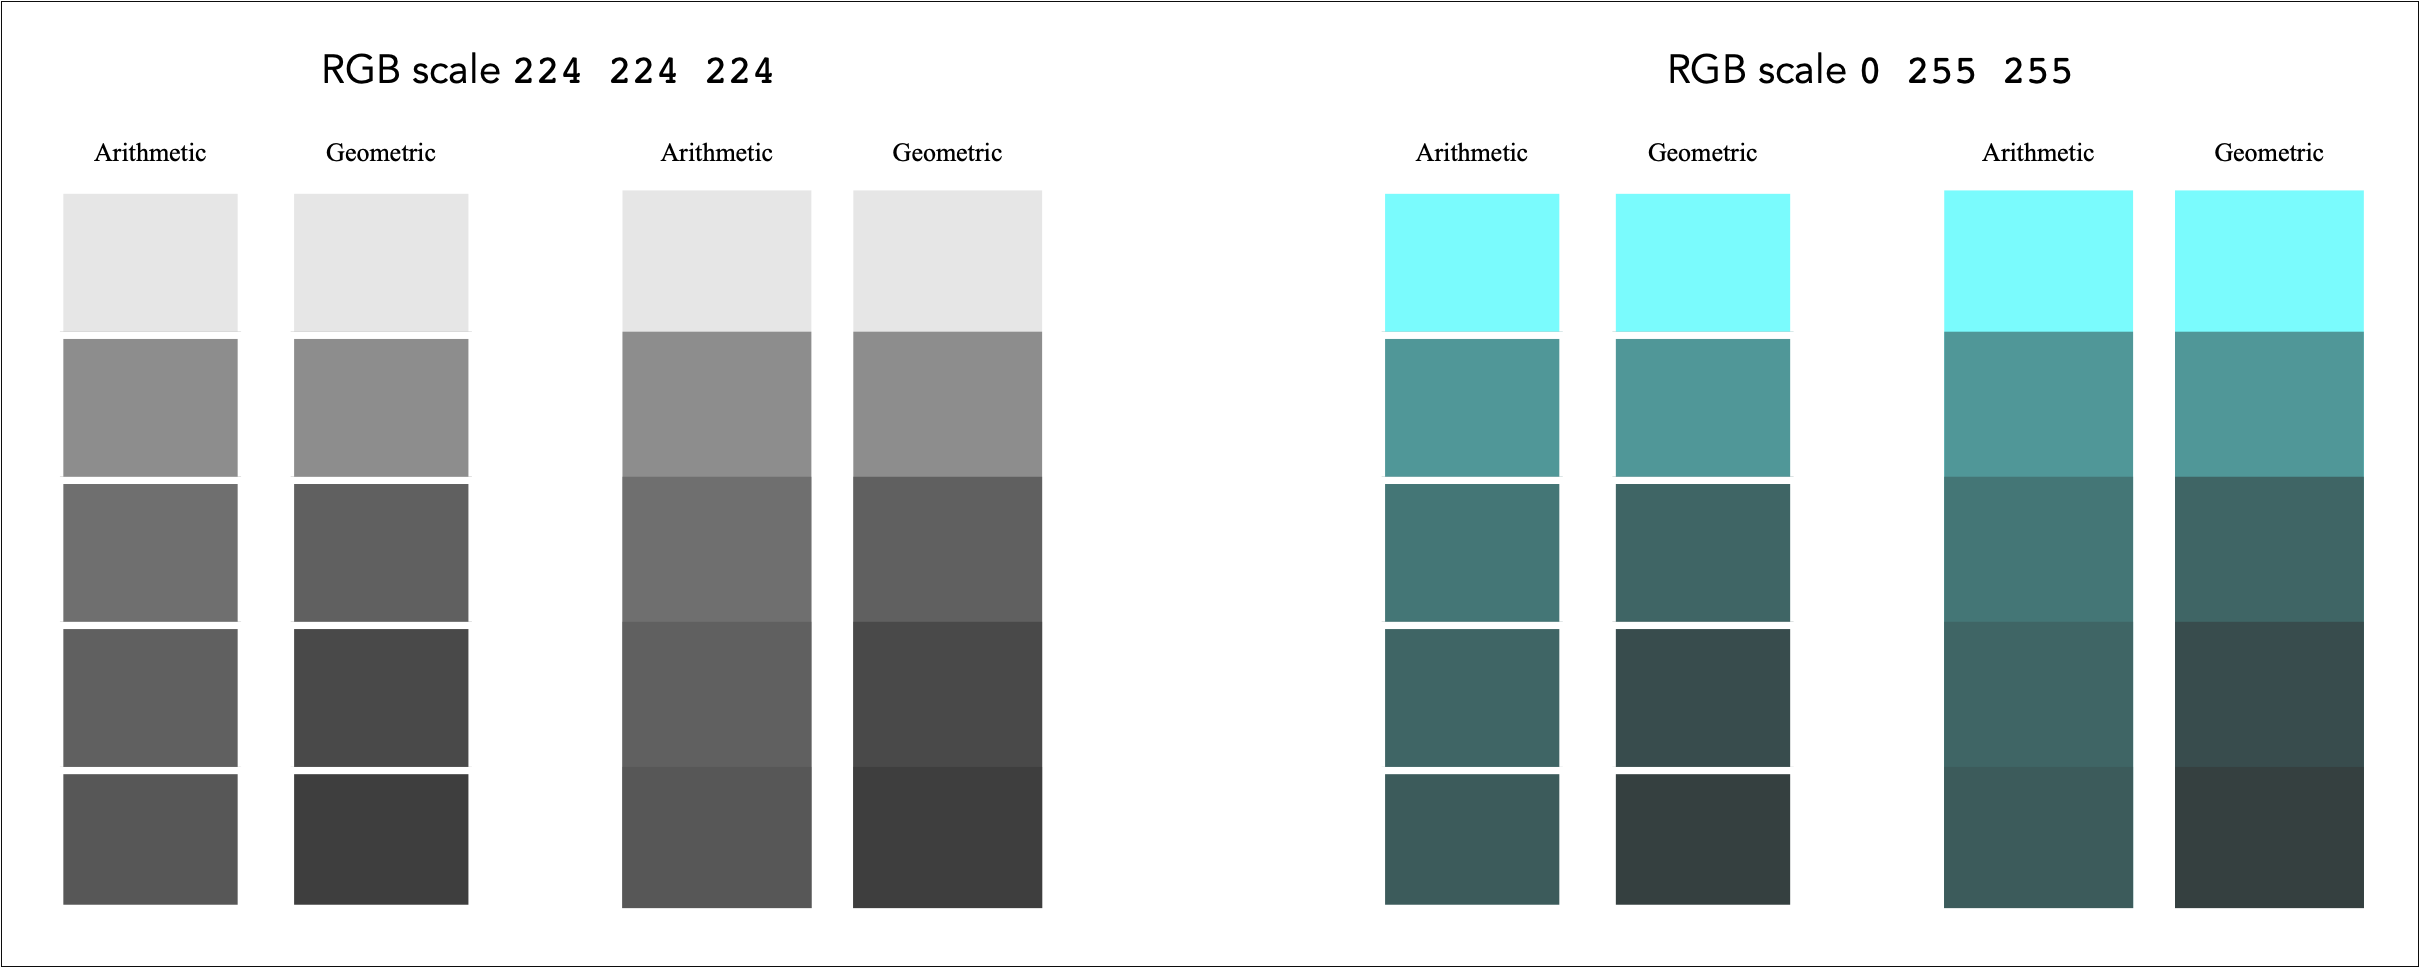
The brightness in each RGB scale is shown in pairs of arithmetic and geometric progression. For example, the far left column shows the arithmetic progression of turning the RGB scale (224 224 224) into 1 as dark, 2 as dark, 3 as dark, 4 as dark and 5 as dark. The second column from the left shows the same RGB scale as 1 as dark, 2 as dark, 4 as dark, 8 as dark and 16 as dark. The same two columns are repeated this time without the white boundaries, and the reason for doing so is discussed just below in Mach bands. The same analysis for RGB scale (224 224 224) is repeated for RGB scale (0 255 255).
Notice how using the arithmetic progression we cannot form any effective contrasts because, as explained above in Steve’s Power Law, for every unit increase in brightness/darkness we only perceive about the square root of that increase (i.e. power 0.5). However, according to Joseph Albers and the Weber-Fechner Law a good approximation to resolving this distorted perception is to apply the geometric progression. That is to say, by using the physical geometric progression in brightness/darkness we perceive it as if it is arithmetic.
Mach bands
Mach bands is a visual illusion phenomenon named after the physicist Ernst Mach, which explains that we perceive a higher contrast between different degrees of brightness/darkness when they come into contact.
In the example just above, there are two sets of column pairs. One set uses white boundaries to separate each shade of gray or cyan. The other set eliminates this boundary and adjoins each shade. Notice how it is much easier to detect the degree of brightness/darkness when the shades come into contact.
This effect has important implications in designing graphs that rely on the use of area implantations and the colour value retinal variable, as for example in choropleth maps and categorical bar charts.
Back to Common fate ⟵ ⟶ Continue to Colour limitations
