Size is a powerful retinal variable that is naturally recognisable as a measure of magnitude.
Smaller or thinner or shorter objects naturally indicate lower importance than larger or thicker or taller objects. Therefore, size is a natural retinal variable for encoding the variation of continuous interval-ratio variables when using point or line visual implantations. The encoding of data points objects and marker labels can vary in size and the encoding of line objects can vary in width.
However, size is not relevant for encoding area implantations because areas are by definition a size object.
Encoding variation using size
The application of the size retinal variable is only justified if it encodes unique variation. A classical example of such application is the so-called ‘bubble’ chart, which is a bivariate scatter plot whose markers vary in size in accord to a third variable. Therefore, a bubble chart is effectively a type of three-dimensional scatter plot.
As an example, consider the time-series of FTSE annual returns, from 1801-2017. The scatter plot y-axis encodes annual return, and the x-axis encodes the year. The scatter marker is encoded using a circle shape, and the size of the circle encodes a third dimension from the data, that of relative spread. Hence, the look of a ‘bubble’ chart.
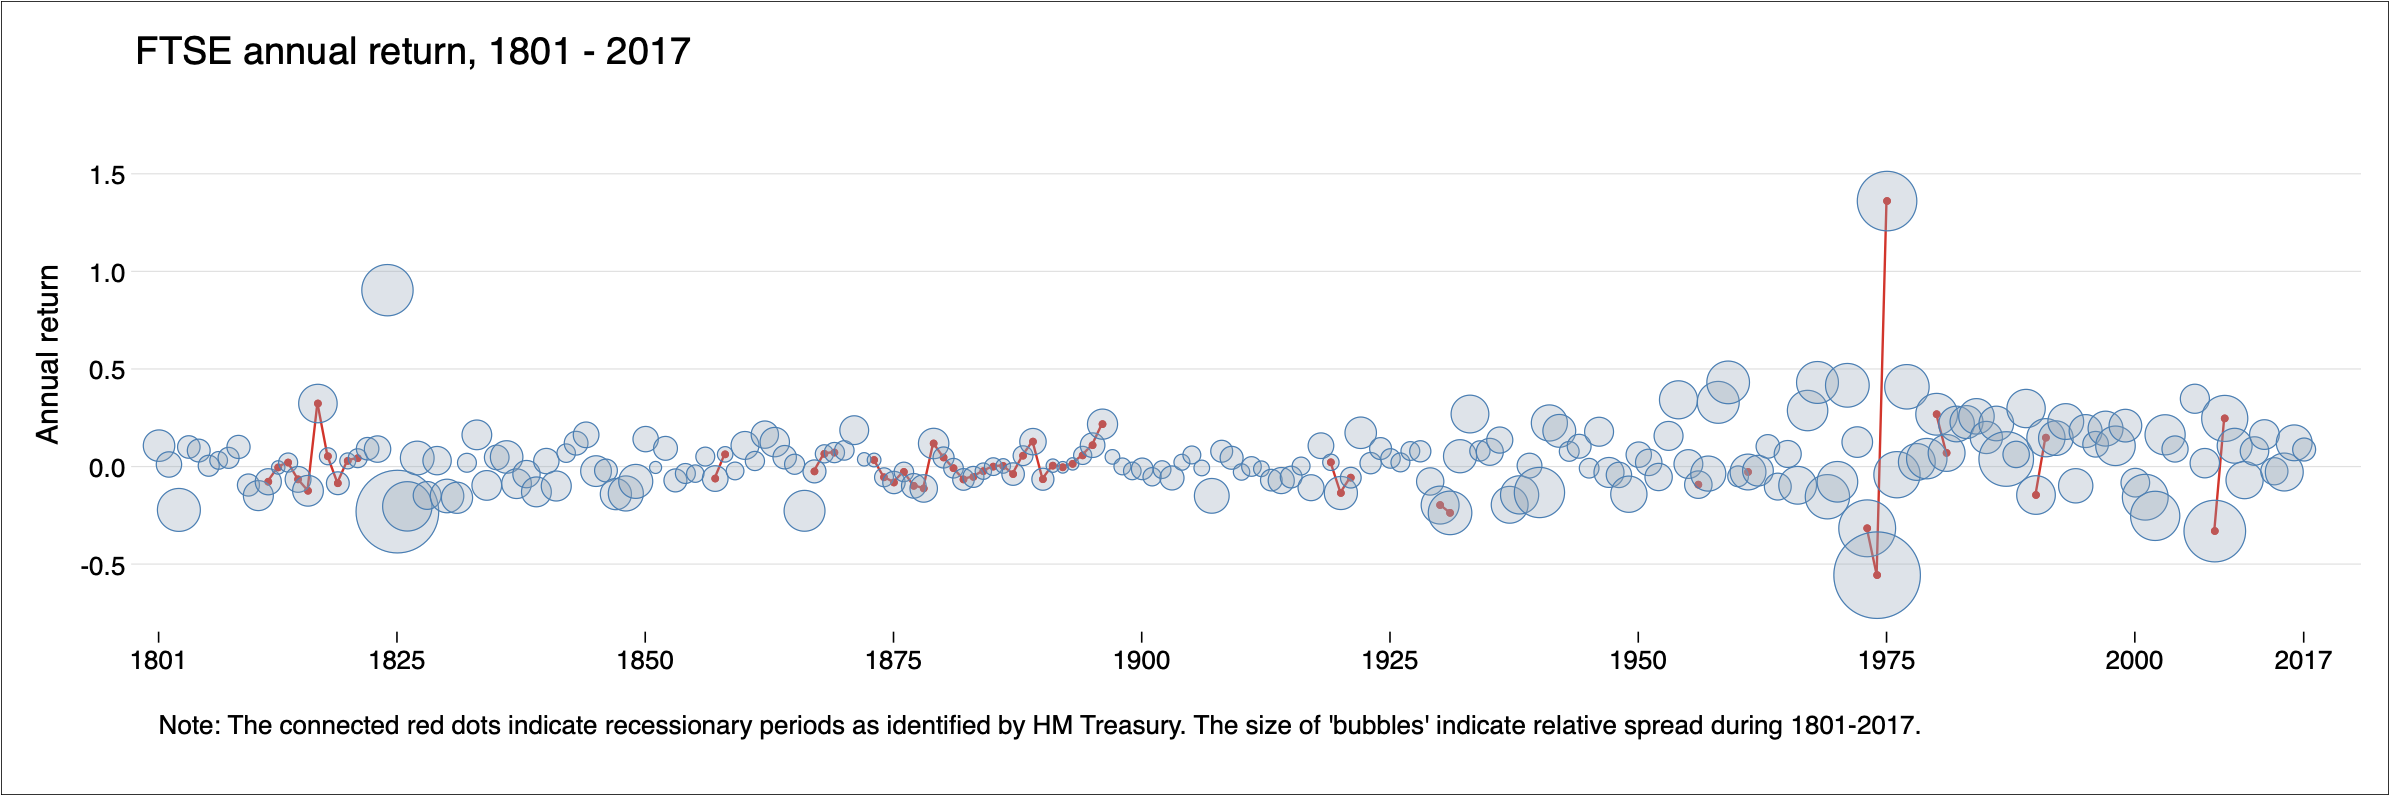
The key message of the above chart is that equity market volatility over time has steadily increased, with more violent recessionary periods.
Size for focusing attention
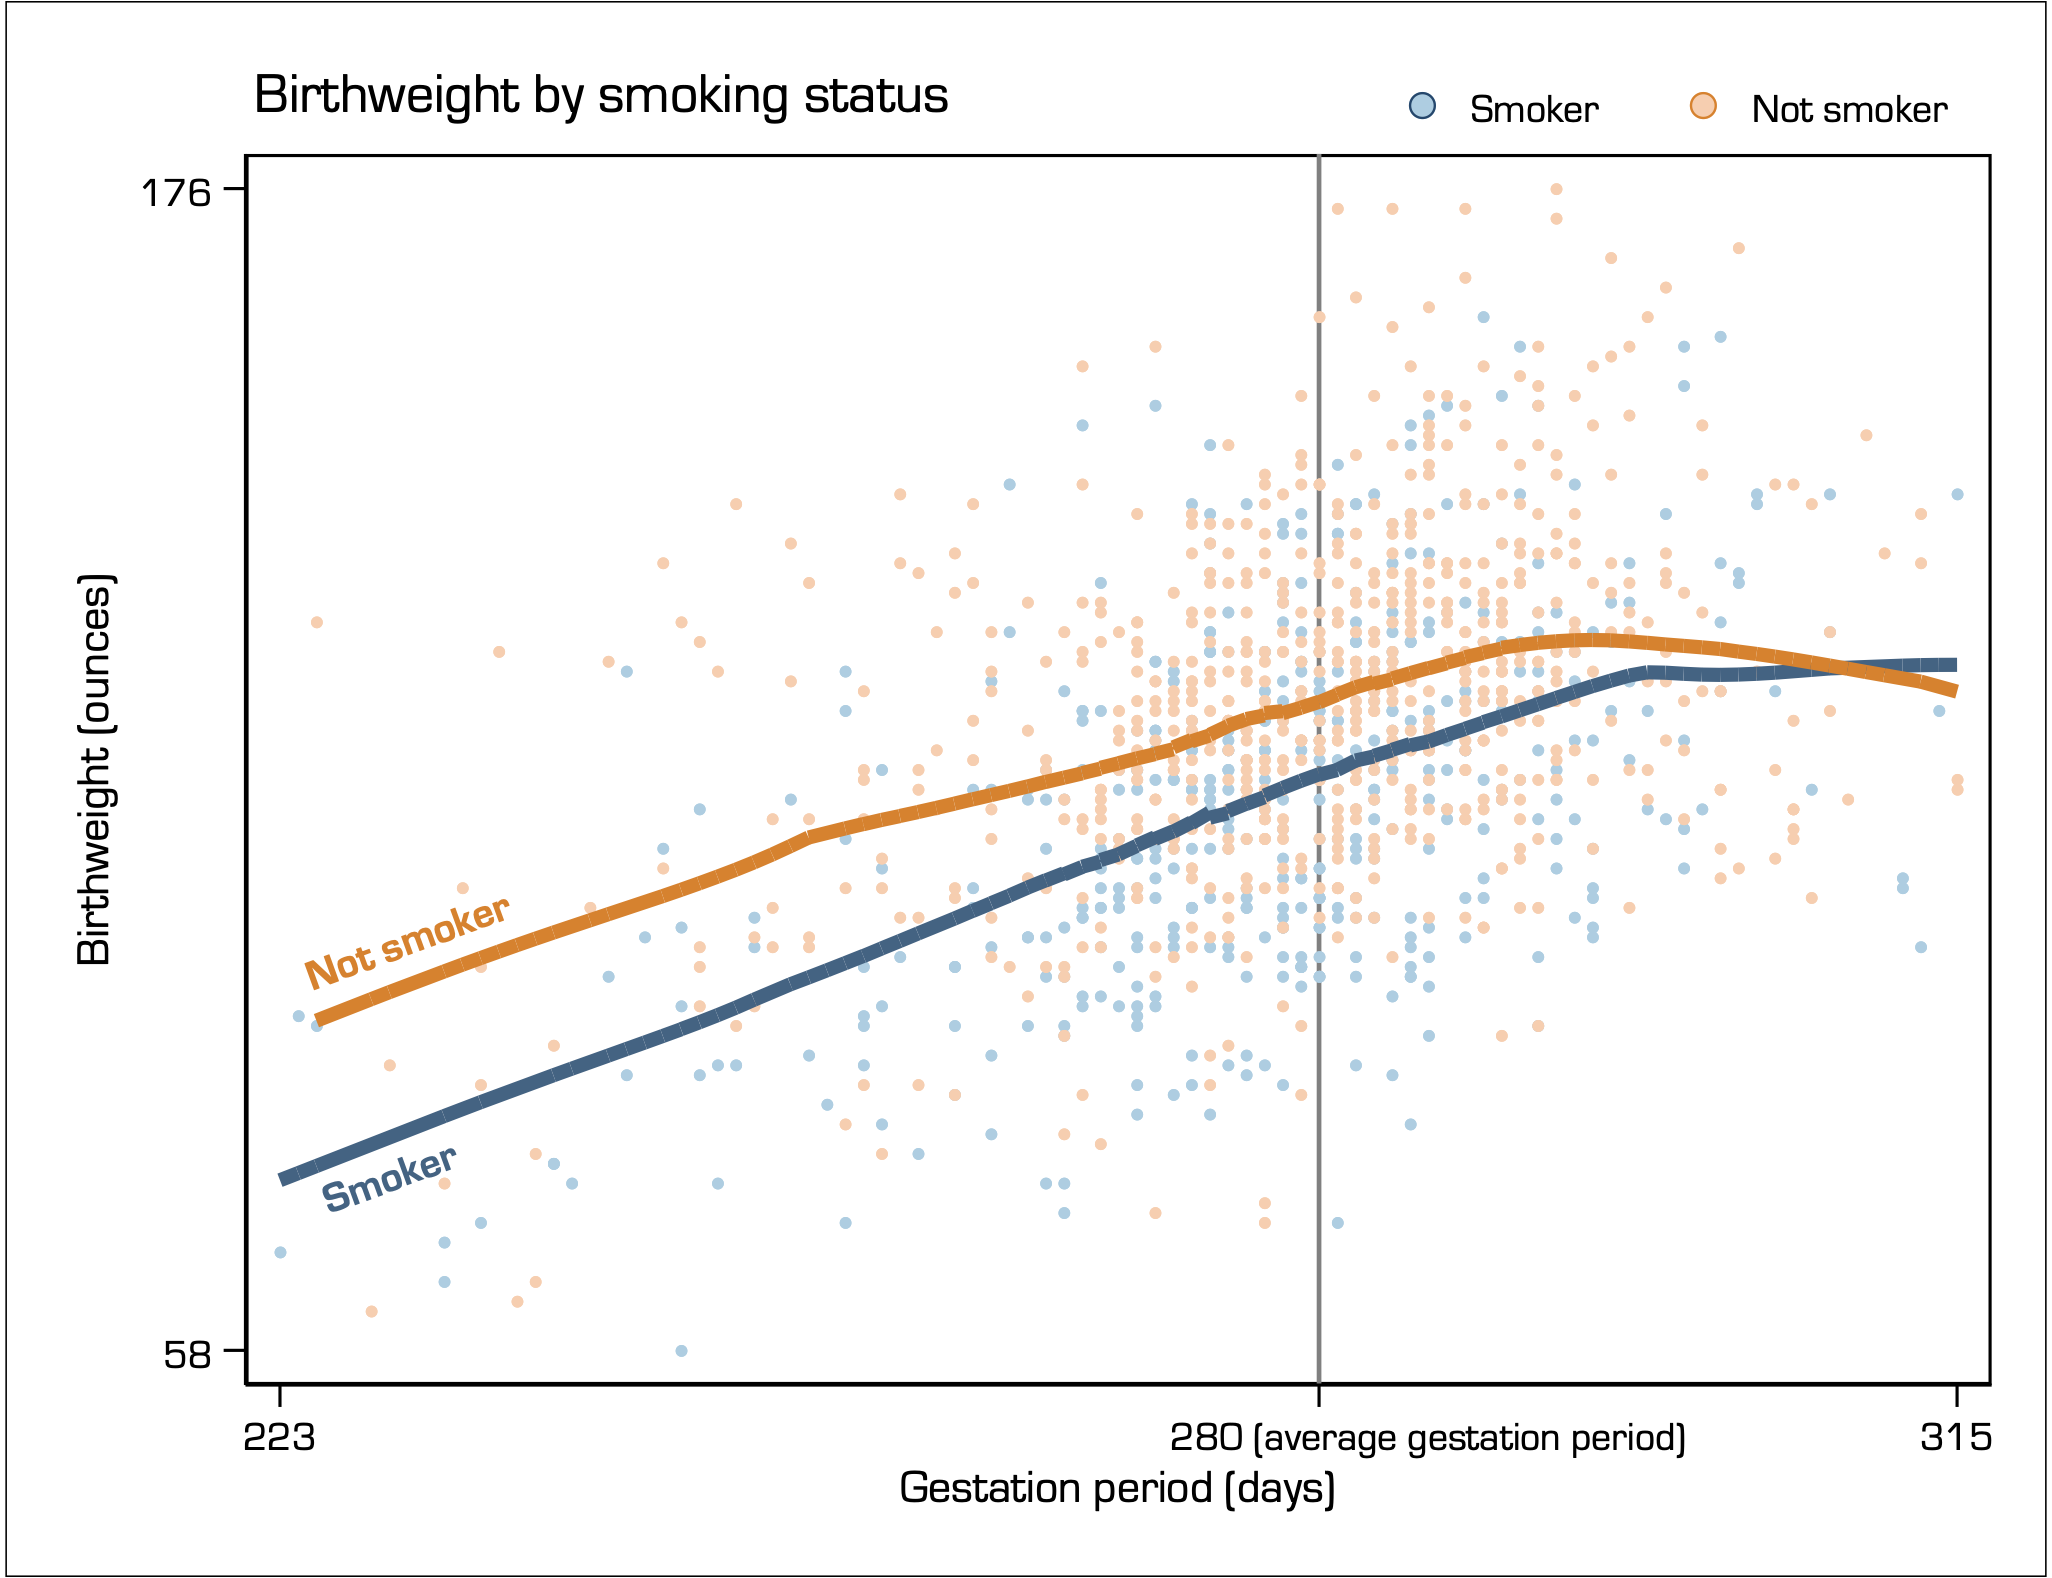
Size is also useful for adjusting the visual prominence of visual implantations so that graph objective is brought into the focus. Consider the relation of birthweight by smoking status of the mother while pregnant.
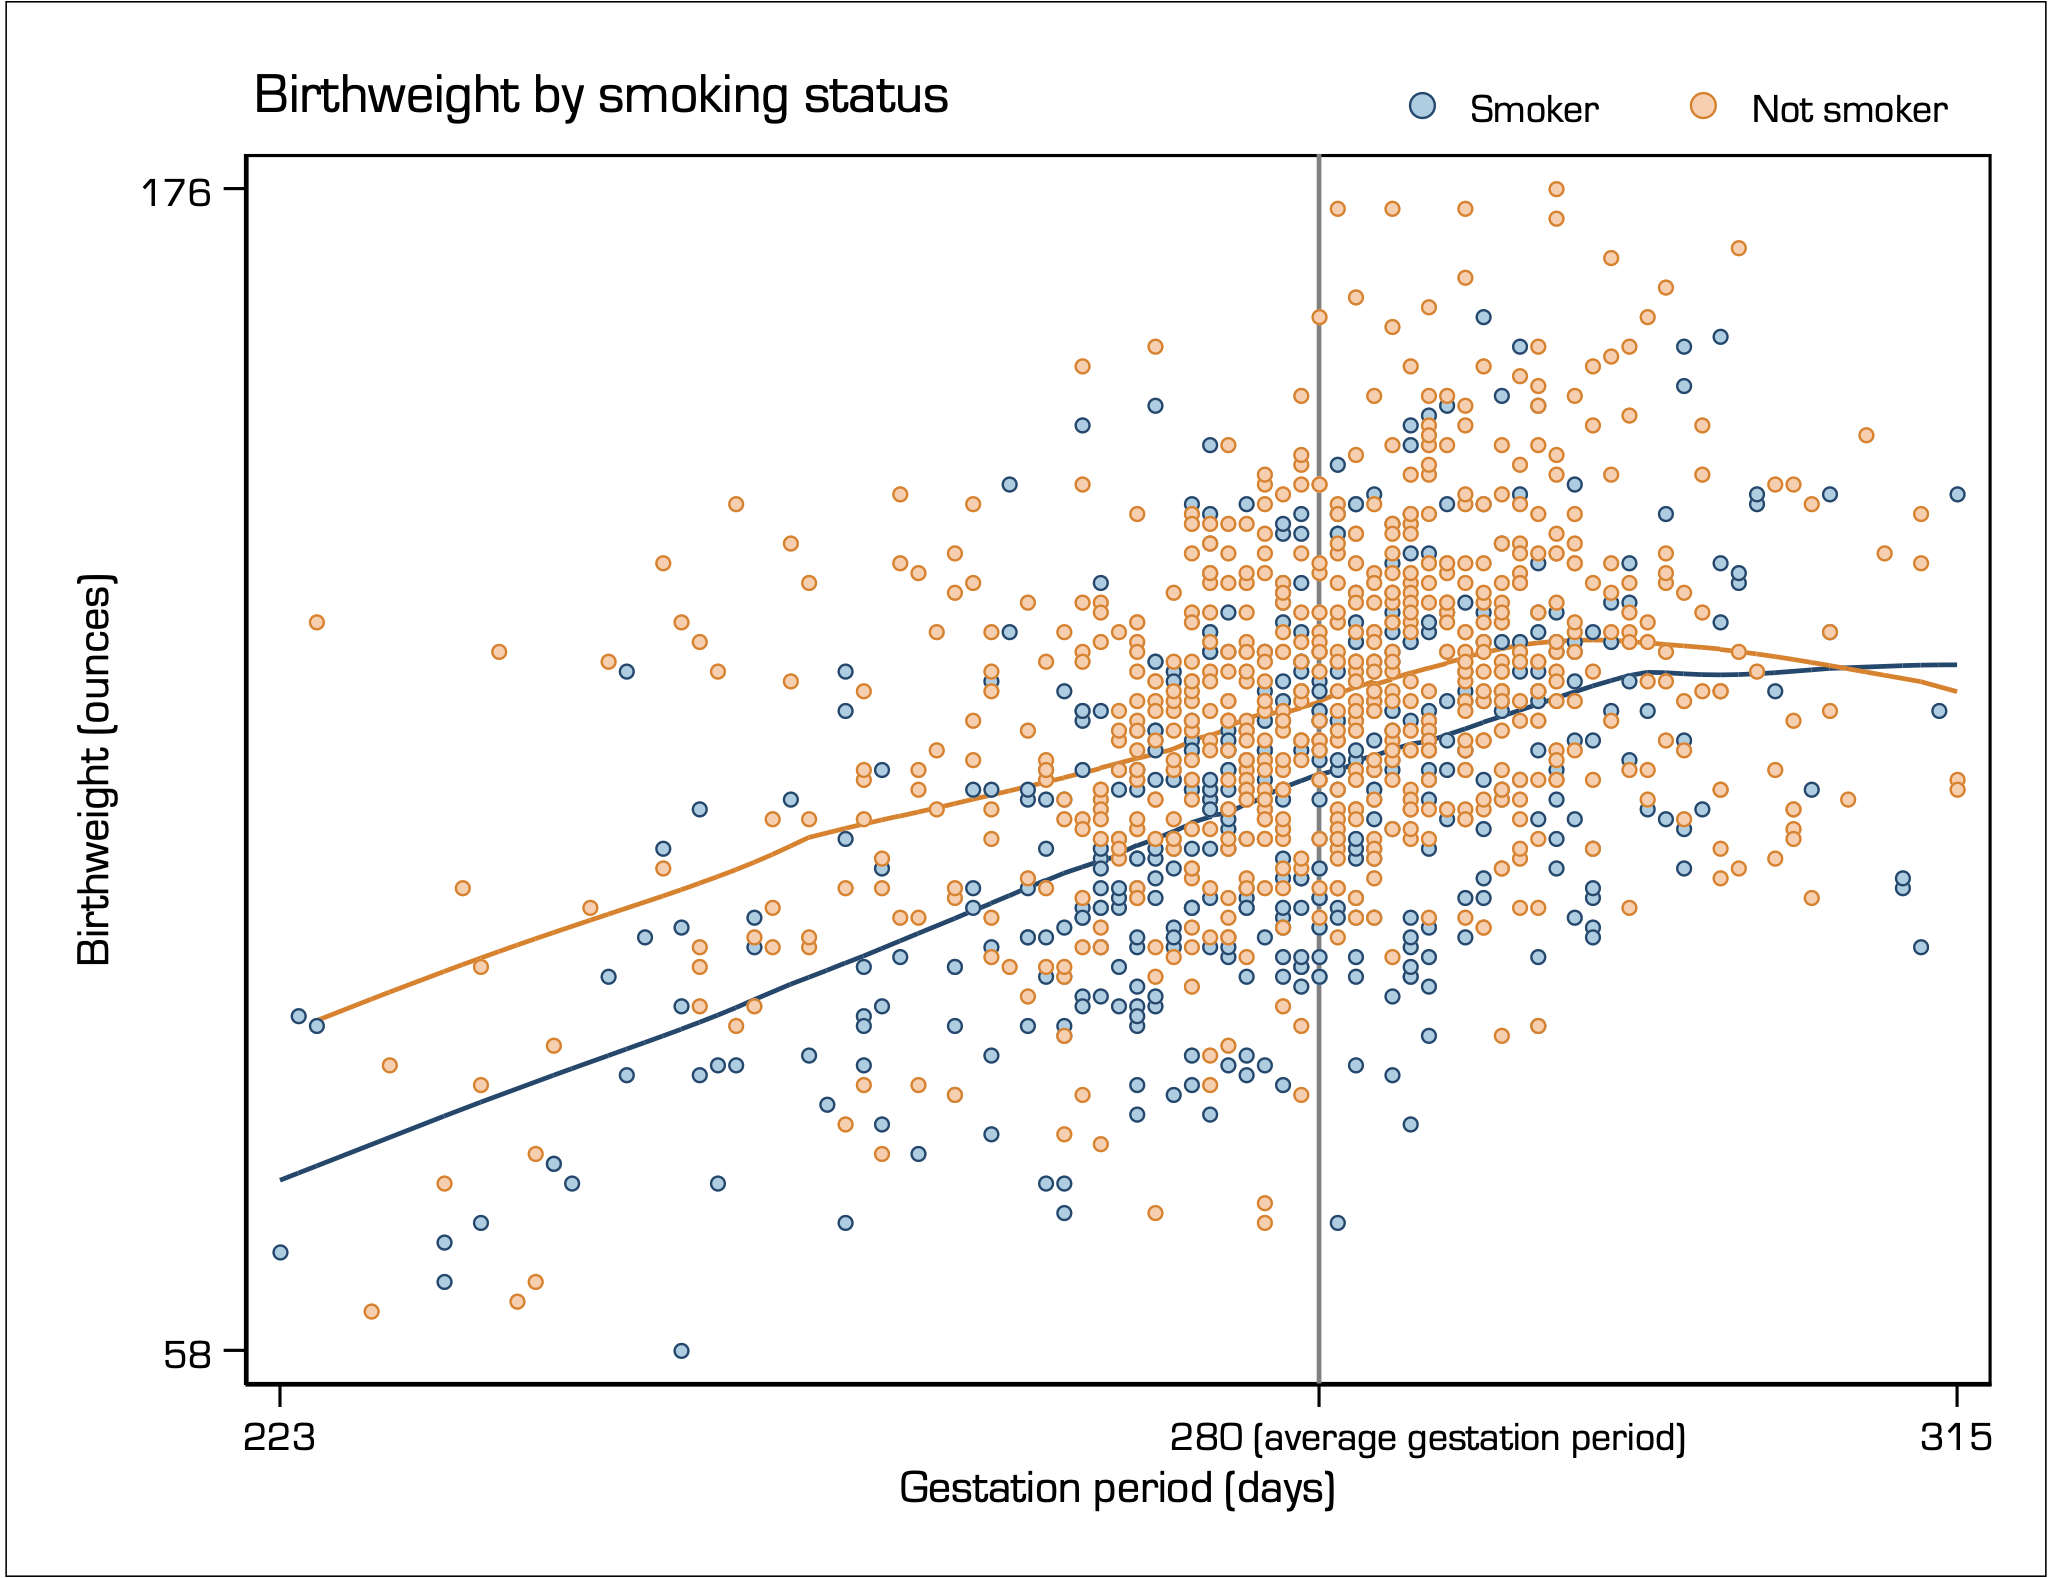
The lines are from non-parametric LOWESS smoothers. There is considerably noise in the data, but if look carefully there generally far more blue dots being lower than orange dots, and the LOWESS lines suggest that women who smoke during pregnancy should have on average a lower weight baby, by comparison to women who do not smoke. This is the key message of the graph and I need to emphasise this.
Therefore, I use size to reduce the visual prominence of the point implantations, and increase the visual prominence of the line implantations , as follows:
Back to Color value ⟵ ⟶ Continue to Shape
