Orientation refers to the encoding of direction, and is only relevant for encoding the direction of certain markers of point implantations, such as the vertical pipe ‘|’, and arrows.
Orientation is not relevant for line implantations or area implantations because these have a default orientation. However, as I discuss below, sometimes we may benefit from switching from points to lines to take advantage of the natural direction in line implantations.
Orientation is most useful for communicating information that is naturally perceived as having the dimension of direction, e.g. wind, cardinal direction, increases and decreases.
Switching from points to lines
Lines have natural orientation, and switching from points implantations to lines allows us to tap into the power of orientation. As an example, consider the following panel data random-coefficients model:

where i = 1, 2, …, 151 is a company index and t = 2000, 2001, …, 2007 is the financial year index, fees is statutory audit fees paid by every company, and assets the key determinant of audit fees. The key research question here is how audit fees are determined for varying levels of sensitivity given the expected level of audit fees.
After estimating the model, I visualise the fitted company-specific coefficients using a scatter plot, as follows:

It is clear from the scatter plot that as the company-specific intercept increases the slope decreases in a non-linear S-shape fashion, thus suggesting the likely existence of an asymptote. In economic terms, as the expected audit fees increase the expected sensitivity to an increase in assets declines rapidly and reverses from positive to negative.
The above graph is accurate, complete, relevant and consistent, but it is not very efficient in helping us decode the shift in direction because it is unnatural to us to understand direction using a collection of circles in a scatter plot. A more efficient graph would be to switch from points to lines, as follows:
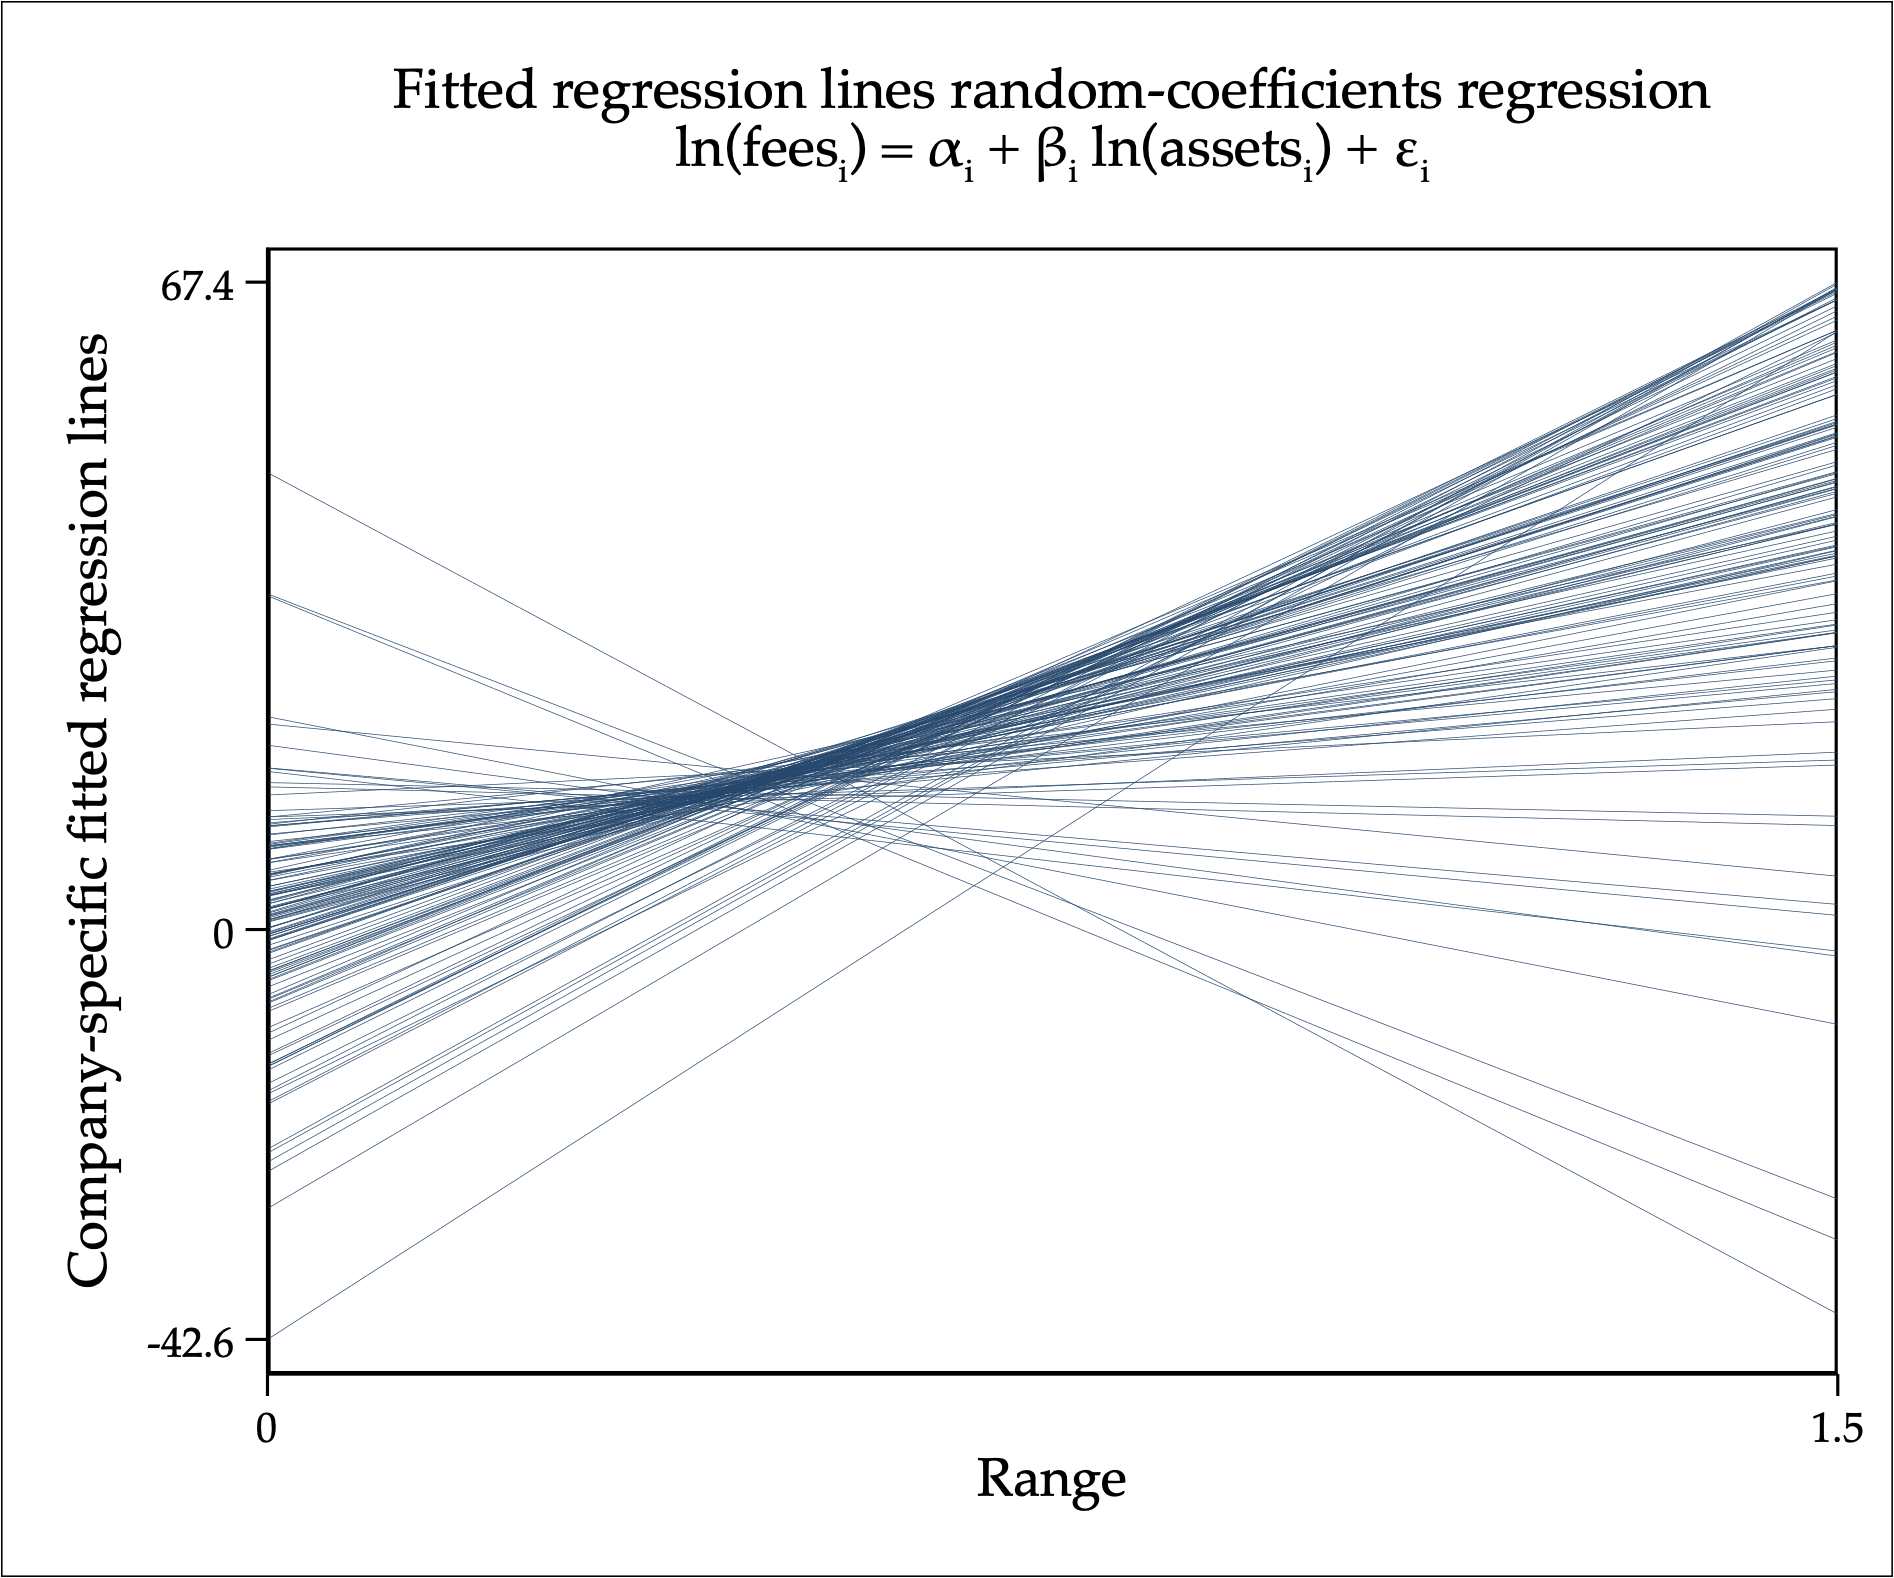
For those trained in statistics, it is now natural and effortless to decode the company-specific regression lines. It is clear the as the intercepts increase the steepness in the regression line decreases and goes from positive to negative.
