The shape retinal variable is only relevant for encoding point implantations.
Geometric shapes
Geometric shapes of equal weight and of no particular context have no scale, and they be used to encode nominal categorical data.
For example, triangles, circles, squares, and diamonds can be used to encode the nominal categories of gender, industrial class, yes/no responses, modes of transport, districts and so on.
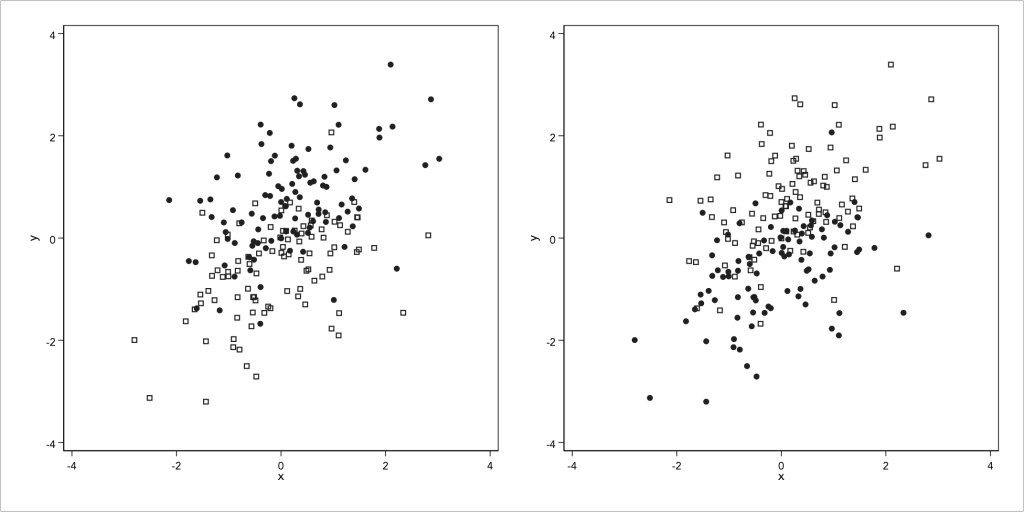
You can think of geometric shapes as being of three types: shapes that have depth that can also be encoded (e.g. circles, squares), and shapes that do not have depth (e.g. a crosses, plusses). You cannot mix combinations of the two in a scatter graph because then the shapes with depth will be perceived of greater weight. Here is an example using simulated data:

The left-hand side graph combines filled-in circles with crosses, and the right-hand side graph combines hollow circles with crosses. In either case, circles have depth but crosses do not, so we perceive more weight for the circles. That is to say, we ‘can see‘ more circles than crosses.
Instead, it is best combine shapes that both have depth, e.g. combining filled-in circles with hollow squares (left-hand graph below) or hollow circles with filled-in squares (right-hand graph below). This is far more desirable combination:
The combination of geometric shapes with filled-in depth or hollow depth enhances contrast. As another example consider a fictional dataset of financial fraud incidences. Let say that there are six types of financial fraud (cheque, forgery, credit card, accounting, money laundering and identity theft), and my research suggests that as we fight to eradicate one type of fraud, over time the criminal syndicates shift their resources to boosting another type of fraud. There are also some types that seem time-invariant (e.g. accounting fraud).
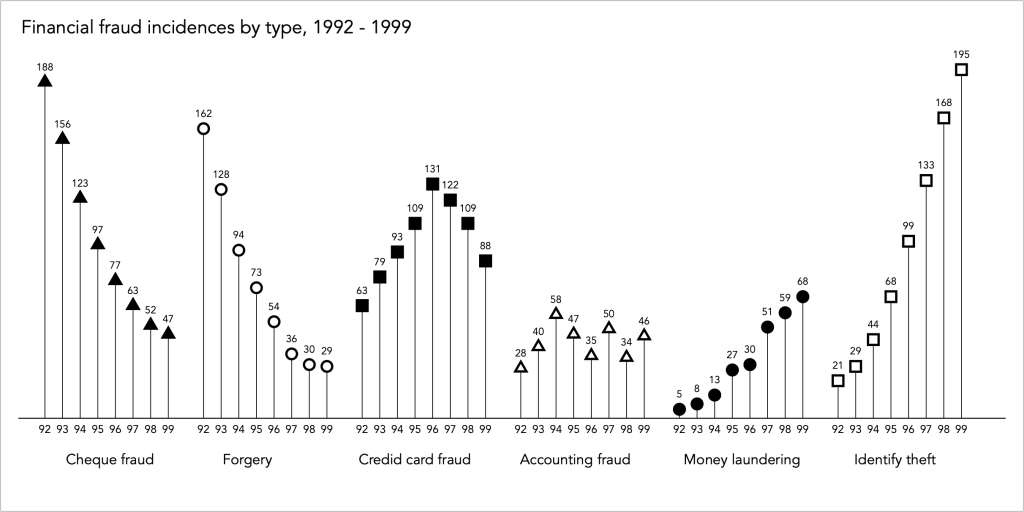
The application of alternating shapes with filled-in depth and hollow depth enhances contrast overall.
Contextual shapes
Certain shapes carry symbolism and are only used to encode specific type of variation. For example, arrow symbols carry the natural meaning of direction in which case the orientation retinal variable becomes instrumental.
Isotype symbols
Isotype symbols are also shapes that carry contextual meaning. To see examples of the use of isotypes in data graphing see Steve Haroz’s website.
As an example, see below the scatter graph of the relation between the generalised cost of travel and the time traveled from Melbourne to Sydney (the data is from Bill Greene’s book on Econometric Analysis):

The data density is such that allows the use of labels instead of geometric shapes. It is easy to decode the density of planes, buses, cars and trains. The use of the colour retinal variable is important to help with the distinction.
Back to Size ⟵ ⟶ Continue to Orientation
