On the 30th of January 2026, the Hellenic Statistical Authority released the below infographic summarising some key findings about the Gender Pay Gap Statistics during 2022-2024 with respect to different age groups.
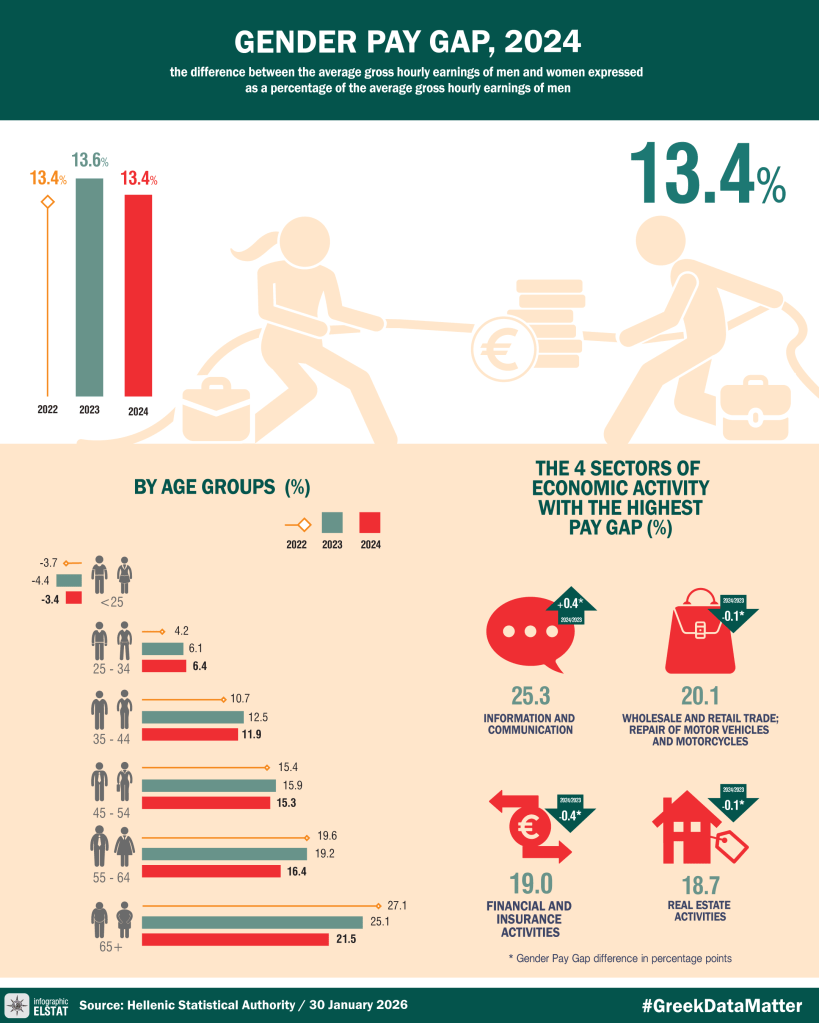
The gender pay gap is measured as the difference between the average hourly wages of men minus the average hourly wages of women, expressed as a percentage of the average hourly wages of men. For example, 5% gender pay gap means that men earn 5% more wages on average than women relative to their own wages.
The graph is of low quality for the following reasons. There is lack of encoding consistency where the year 2022 is encoded as a dropline and years 2023 and 2024 are encoded as bars. As a result, the decoding efficiency is low as it takes effort and time to understand the contrasting encoding choices. Furthermore, while the contrast of gender wage gap across age groups is clear and it is easy to decode an average increase over the three years as age increases, it is not clear how these changes vary over time. The data is not organised in an intuitive manner that would enable effortless decoding of time variation. Lastly, some encoding design choices are unnecessary adding mental burden again to decoding the data itself.
Graph objective
The graph objective is to present the same information as offered by the infographic but in a manner that makes it easier to contrast both the time evolution of gender wage gap across age groups and the variation in the categorical levels of age groups. right now, the infographic focuses only on the contrast on age groups but fails to provide and efficient visualisation for time evolution.
Data management
The data is collected directly from the published infographic presented above. The source data is provided at the Hellenic Statistical Authority webpage of Gender Pay Gap Statistics ( 2024 ) (Version 1.0) and is described in “Table 2: Gender Pay Gap by age groups 2022, 2023, 2024” of this PDF publication.
The data is inputed manually in a Stata do-file which is provided at the end of this webpage. There is one important change in the presentation of the data. I choose to revert the signs of the gender wage gap and measure the difference between women’s average wages to the men’s average wages. As humans attach more positive feelings with positive numbers, this choice reflects the desirable social target of not having any negative wage gaps (where negative suggests something undesirable).
Visual implantations
The time-evolution of gender wage gap is encoded with a series of line implantations, one for each age group, arranged in a time line orientation from year 2022 to 2024 (three points in time). Line implantations are naturally perceived as evolutions over time thus making decoding intuitive.
The level of gender wage gap is encoded using point implantations for each year and age group. The beginning and ending levels (for 2022 and 2024) are encoded with circular points whose diameter matches the width of the line implantation thus giving the impression of rounded line edges. The middle point implantation for 2023 is encoded using a much larger circular point to accommodate also the identification of the age group category.
Area implantations are used to encode the magnitude of imbalance between negative and positive gender wage gaps, again using matching colour hues to points and lines.
Retinal variables
The key encoding variable for contrasting groups is the colour retinal variable. Age groups with positive gender wage cap (where women’s average wage is greater than men’s) are contrasted with the age groups with negative gender wage gap using two colours, which are consistently applied across points, lines and areas.
The age categories within a positive versus negative gap group, are encoded using the colour value retinal variable, with darker values encoding higher age groups.
The size retinal variable is used only to increase the visual prominence of the point and line implantations.
Areas are enclosed around thick dark blue lines to leverage on the Gestalt principle of enclosure as perceive objects enclosed within common areas as groups.
Graph identification
External identification includes a grand title describing the overarching graph objective, and subtitle providing more context on the unit of measurement used to measure the gender wage gap. A note to the graph describes the source of the data and its date of publication.
The internal identification of the colour retinal variables is achieved by placing annotations inside each coloured area described as “women earn more” versus “men earn more“, using the assoicated colours.
The data point for 2022 and 2204 are directly identified using to pseudo y-axes. The age groups are also directly identified on the graph within each line implantation.
Graph enhancement
A key piece of information and policy target that needs to be conveyed is the zero gender wage gap. This level is emphasised using a thick blue line that serves two goals: (1) it acts as a reference line that visually segments the two areas of positive and negative gender wage gap, and (2) to encode the level of 0 which is identified as “zero gap“.
The aspect ratio is managed in a portrait orientation to allow for easier contrast of the evolution of time line, where a landscape orientation would flatten the lines and make it difficult to discern any individual time variation.
A Greek flag is added on the top left of the image thus making this the first piece of information to be read as English is read from left to right. The flag acts as a mental cue to allow the quick association of this information to Greece. The flag is encoded using Unicode hexadecimal escaped sequences, and specifically using the Apple Color Emoji typeface .
Visual decoding/perception
Here is my proposed solution to the graph objective:
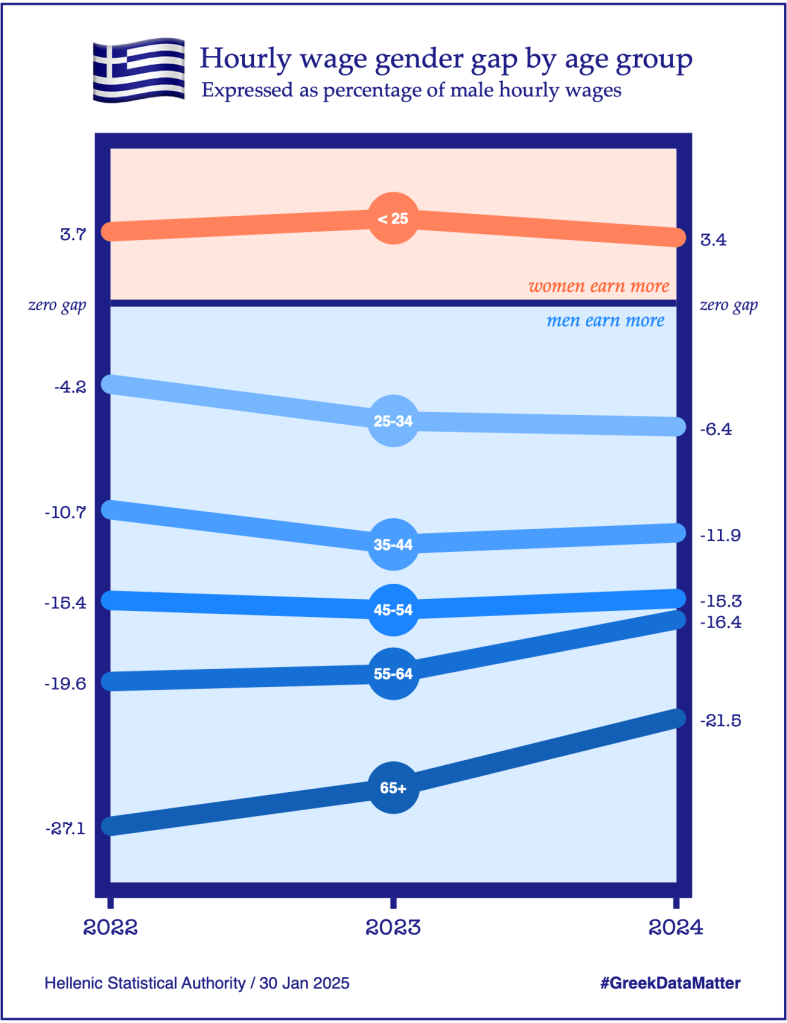
Key insights include the persistent gap in under 25 year olds with women earning more than men on average, but the gap is flipped for all other age groups with a monotonic increase in men earning more than women as age increases. The gaps at 55-64 and 65+ groups have seen a sharp radical decline but this is likely due to a generation change, especially with women having longer life expectancies than men. It is worrying that in the most productive age group, the 25-34 year olds, the gender age gap has risen by more than 50% in 2024 relative to 2022 and this should be a major policy concern. These insights were almost impossible to be decoded using the infographic provided by the Hellenic Statistical Authority.
Download the Stata code for reproducing this analysis: greek_gender_wage_gap.do


