Insurance customers are legally required to provide truthful and complete personal disclosures, so that insurance companies can calculate fair premiums. Any redacted disclosures or misrepresented disclosures not only detract from the usefulness of this data for risk classification but also expose the customer to serious legal remedies, even the cancellation of the insurance contract when it is needed at most.
Insurance advisers help customers understand complex insurance products and assist them in completing the lengthy application for insurance. Their presence is supposed to mitigate the information asymmetry between the customer and the insurance company. However, if advisers are remunerated using sales-based commissions, then they have conflicted incentives to act against the customers’ best interests.
That is to say, if the adviser is paid at the sale of a contract then they have the incentive to make this sale happen regardless of the truthfulness in the disclosure. This conflict of interest has been identified as the source of systematic misconduct in advisers by a number of inquiries resulting in the ban of commissions in the UK and the EU , as well as recommending the ban in New Zealand and Australia.
Together with Doron Samuell, we looked at the disclosures collected by insurance advisers versus the disclosures collected by telephone operators (i.e. someone completing an insurance application directly through an insurer). The differences are striking. Our headline finding is that the collection of customer data through an advisor, compared with directly by an insurer, always results in lower customer disclosures and in many cases by more than half.
This means that the risk classification exercise is less effective when an adviser collects the data. The effect is so large and systematic that it cannot be due to chance alone. It is important to note that our research design imputes the counterfactual disclosure pattern, that is what a customer who is screened through an advisor would have disclosed if that customer had used a telephone operator, and the opposite. Our research paper was published here, and we were then invited to write a commentary at a practitioners journal here.
Graph objective
The graph objective is to produce a visual comparison between the level of disclosures with advisers versus telephone operators. There are two stages in disclosure. The first is the quotation stage, where the adviser observes key actuarial data that determines the baseline premium and presents a comparison of quotes across insurers. The baseline risk at the quotation stage is calculated on the basis of age insured, gender, degree of occupational hazard, and smoking status. The adviser’s main concern at this stage is to present an attractive collection of competitive quotes to the customer. Given these disclosures, the customer accepts a baseline quote and proceeds to the second stage – the screening stage. Note that the quotation stage is does not lead to a decline of insurance, and even highly risky occupations will still be given individual consideration.
The screening stage application can be completed either with the assistance of the adviser or the insurer’s telephone operator. In this stage, the customer must answer a great number of personal questions regarding medical conditions, lifestyle risks and habits. If there are no additional material disclosures, then the application is determined to be a ‘cleanskin’ application and the customer is offered the baseline premium that was determined at the quotation stage, otherwise known as ‘standard terms’. If there are additional material disclosures, e.g. due to medical history, then the customer may be offered a more expensive contract, also known as ‘modified terms’. If the disclosures are considerable, e.g. habitual recreational drug use, then the customer may be declined insurance.
I want the data graph to concisely show the key disclosures made at the quotation stage and the screening stage, and then show the decision to offer standard terms, modified terms or decline.
Data management
As explained in our research article, the original data is proprietary and cannot be shared. All I can say is that it is sourced from the underwriting division of a major insurance company operating in the Oceania region.
We were given access to all disability, total and permanent disability (TPD), trauma, and life term (death) applications submitted during Nov 2014 and Dec 2018. All retail applications covering disability, TPD and trauma must go through advisers, but life term insurance can be applied either through advisers or directly online. The dataset contains thousands of observations. In addition, we are given access to a separate dataset of contract decisions, on whether the application is offered at standard terms, modified terms, or is declined by the insurer. This dataset also contains thousands of observations. The population of interest is adults (18+) who have applied for life risk insurance through a personal financial adviser.
To generate the graph, I need two sets of disclosure rates from customers being screened through advisers or screened through the telephone operator. As explained above, our research design imputes the counterfactual disclosure, so the graph will show the telephone operator rates versus the imputed counterfactual adviser rates (i.e. the so-called ‘treatment’ effect).
The Stata code at the end of this page, contains the estimates reported in our published research article and describes the code for reproducing this analysis.
Visual implantations
One way to contrast this information is using horizontal bars, a form of area visual implantation. I plan to juxtapose two sets of bars. To the left, the length of horizontal bars will encode the disclosure rate when customers are screened through advisers. To the right, the length of bars will encode the disclosure rate when customers are screened through telephone operators.
The contrasting bars will have a common origin, and the extend to the left and to the right. As I plan to use colours to differentiate the two sets of bars, contrast two colours in successive bands can create visual artefacts similar to the Café wall illusion. To mitigate this visual artefact, I add a point visual implantation to make clear the point of each origin.
Retinal variables
The area implantations (the bars) are encoded with the colour retinal variable, with two highly contrasting colour hues.
The point implantations (the points at each origin) are encoded using the vertical pipe shape (i.e. the character |) in black.
Graph identification
Internal identification is achieved through a legend that identifies the colour retinal variable for the area implantation, i.e. that the bluish colour is for client disclosures through advisers, and the orange colour is for client disclosures through the insurer’s telephone operators. The legend is shown as part of the grant title “Client disclosures”, which is a key component of external identification.
There is no need to identify the point implantation because it does not encode data, and it is only there to enhance visual decoding by reducing the effect of visual artefacts.
An important part of external identification is the classification of the successive bars into three categories: Quotation-level disclosures, Screening-level disclosures, and Decision-stage offers.
Direct identification encodes the length of each bar in terms of percentages. In this way, the whole data is disclosed as part of the graph.
Graph enhancement
As with every bar chart, it is important to order the bars in terms of magnitude. For this data graph, this order has to be achieved within each one of the underwriting stages.
The choice of horizontal bar charts follows studies on visual perception that show how this orientation enhances accuracy in decoding. It is also convenient for listing the lengthy text labels in naturally horizontal orientation. Given this choice, the aspect ratio must be adjusted with a larger height than length.
In one of the first iterations of the graph, I maintained an all white background, without any shading behind each bar. However, I noticed that because of the many pairs of coloured bars, it was difficult to visually align the text label to each bar. The Gestalt principle of enclosure explains that a simple fix to this problem is to enclose each set of bars in a common area, hence the addition of shaded areas behind each set of bars.
Visual decoding/perception
Here is my proposed solution to the graph objective:
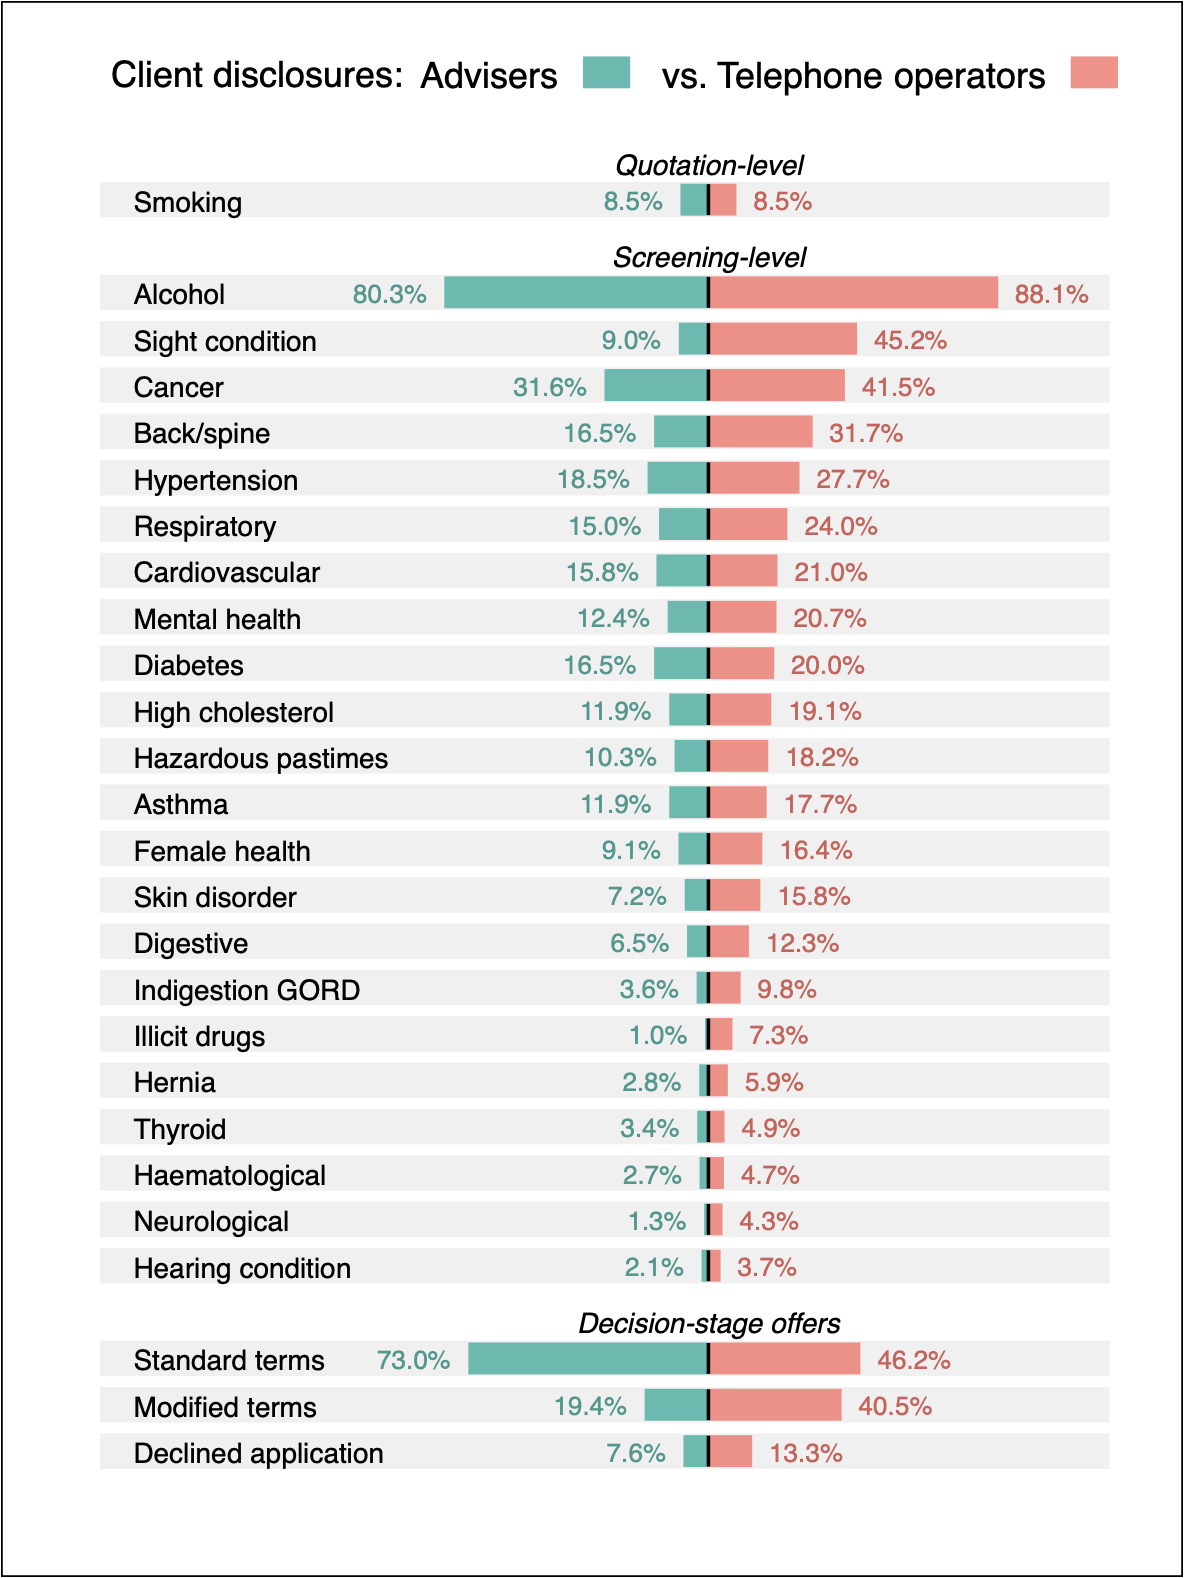
All screening-level disclosures are lower when the client goes through adviser than a telephone operator. For example, disclosures for back/spine conditions, which are central to long-term disability claims, are by 92% lower when customers are screened through advisors than by telephone operators. Even more shockingly, disclosures on the use of illicit drugs is 630% lower through advisors than telephone operators!
When these findings were presented at a conference at the University of Sydney, we were asked whether the lower disclosures could in fact be more accurate and the telephone operator disclosures might be over-disclosed. We find this to be unlikely. After examining epidemiological evidence for population disease, substance use and lifestyle activities, both advisor and insurer screened customer disclosures are implausibly lower than the general population.
Clearly, those who seek disability products are not necessarily representative of the general population, but adverse selection explains that if anything, those seeking disability insurance should be even riskier.
Only one disclosure is identical in both groups: smoking. A seasoned advisor knows that smoking disclosures inflate premiums by 25-50 per cent, depending on the product. Importantly, smoking is predominantly disclosed determined at the quotation level where baseline premiums are determined. This means that advisors receiving commission-based remuneration get a substantial lift in revenue when their clients admit smoking. However, with other medical and lifestyle disclosures at the screening-stage, the more that is disclosed the lower the probability that a customer will be offered a contract or that a contract will be desirable.
As shown in the figure above, a customer going through an advisor has a 73 per cent chance of being offered standard terms, whereas going through a telephone operator this falls to 46.2 per cent, with an almost equal chance of 40.5 per cent of getting modified more expensive terms, and 13.3 per cent of being declined insurance. If an advisor relies on commission-based sales, they are naturally adversely impacted when customers are not offered a contract or not offered a desirable contract. If our intuition is correct, there is a large numbers of customers with legally insecure contracts based on incorrect disclosures.
Download the Stata code for reproducing this analysis: disclosures.do


